
Introduction
The dashboard gives the highest level and generic overview of the usage of the launched or the active Search Assistant. It displays the transaction data for analytics like total users, total searches, result rate, clicks, and average click position. For more detailed analytics on specific aspects refer to the respective sections.
To access the dashboard,
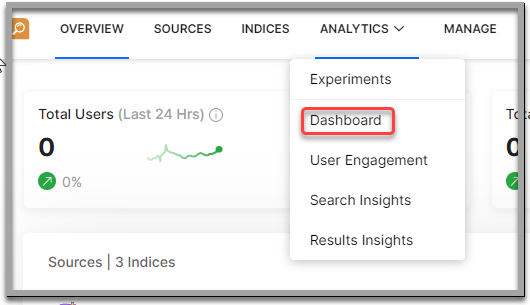
- Click the Analytics tab on the top and select Dashboard from the dropdown

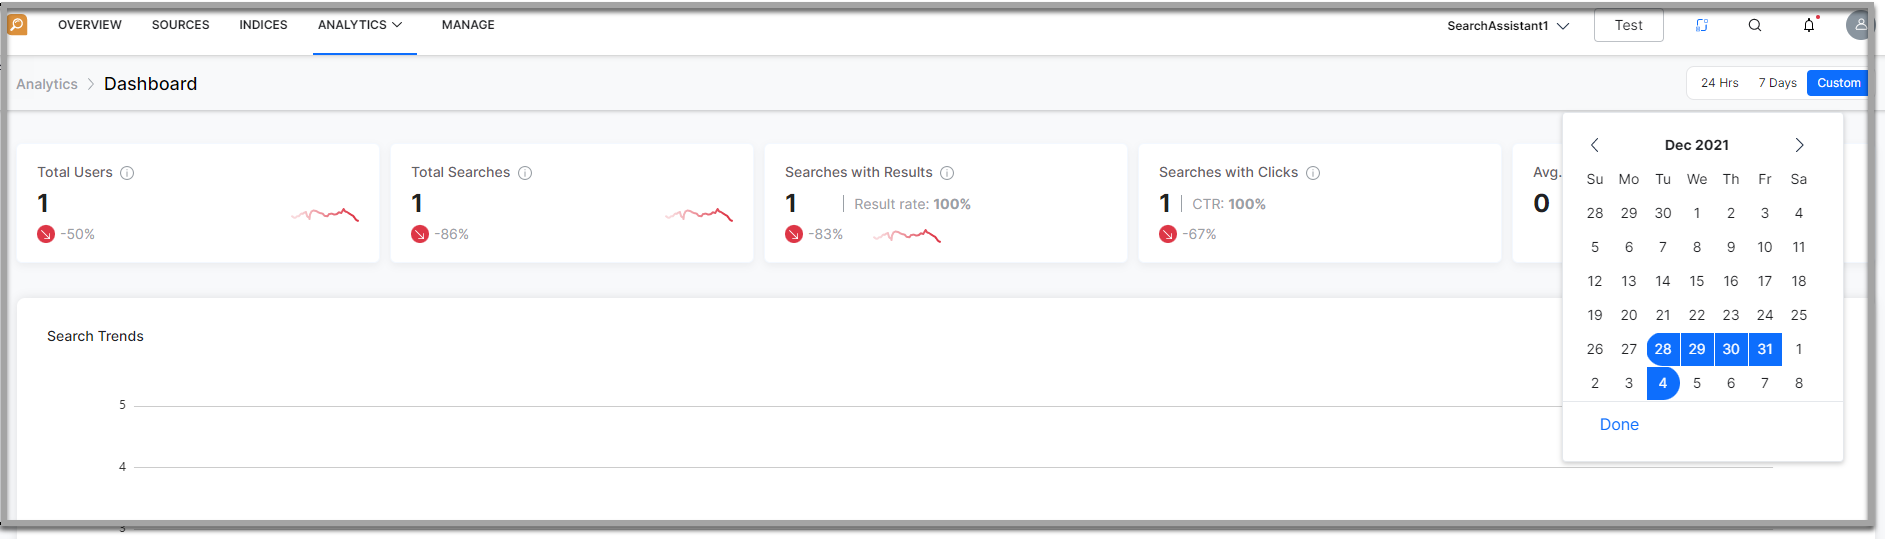
- You can filter the metrics on a specific time period or a time window like:
- the past 24 Hrs
- the past 7 Days selected by default, or
- a custom period range selecting the start and end dates from the date picker provided

Metrics
The following table gives the details of the dashboard metrics:
| Metrics | Description | Additional Notes |
| Live Data | ||
| Total Users | The number of unique users who accessed the Search Assistant during the selected period. | |
| Total Searches | The total number of searches performed during the selected period. | |
| Result Rate | Percentage of searches that returned at least one result. | |
| Clicks | The number of searches where at least one result was clicked by the search user. | |
| Average Click Position | Average position of clicks performed on the search results. For example: For a query “iPad”, if there were the following clicks:
The click position will be (1 + 1 + 3 + 10) / 4 = 3.75 |
|
| Search Trends | It gives an overview of :
|
|
| Top Search Queries |
|
|
| Top Search Queries with No Result | Top queries that yielded no results. Query-wise split is also displayed along with the number of times it was searched. |
|
| Top Search Results | Search results that appeared the most number of times. For each search result the following details are listed:
|
|
| Feedback | End-user feedback analysis
|
|
| Most Clicked Position | Position at which the search results were clicked by end-users the most number of times. Sorted in the descending order of the number of clicks. | |