Introduction
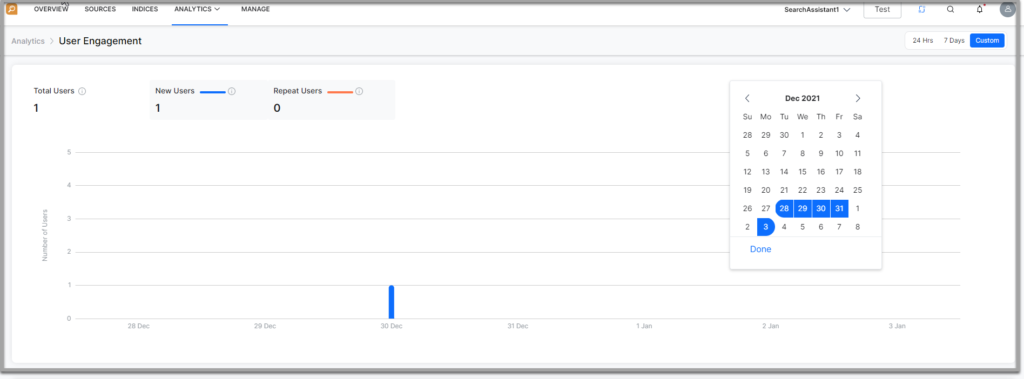
User Engagement Metrics throw light on the quality of user engagement and uncover potential gaps to be addressed. SearchAssist’s User Engagement Metrics feature displays the relevant metrics with information on how the end users use their Search Assistant.
To access user engagement, take the following steps:
- Click the Analytics tab on the top and select User Engagement from the dropdown

- Filter the metrics on a specific time period or a time window like:
Metrics
The following table gives the details of the user engagement metrics:
| Metrics | Details | |
| User Data Trends | ||
| Total Users | The number of unique users (based on the IP address) who performed search during the selected period. | |
| New Users | The number of new users who performed a search during the range selected. | |
| Repeat Users | The number of returning users who performed a search during the range selected. | |
| Busy Hours | The volume of users who performed a search at different hours of the day. You can increase or reduce the hours tracked in a day using the slider underneath the graph. | |
| Most Used Devices | Devices used by the users to perform the search sorted in the descending order of usage numbers. For example, desktops, mobile phones, etc. | |
| Most Used Browsers | Browsers used by the users to perform the search sorted in the descending order of usage numbers. For example, Chrome, Firefox, IE, Safari, etc. | |
| Demographics | The geographical location (country-wise) of the users performing the search, sorted in the descending order of usage numbers. | |
