Performance Dashboard Metrics
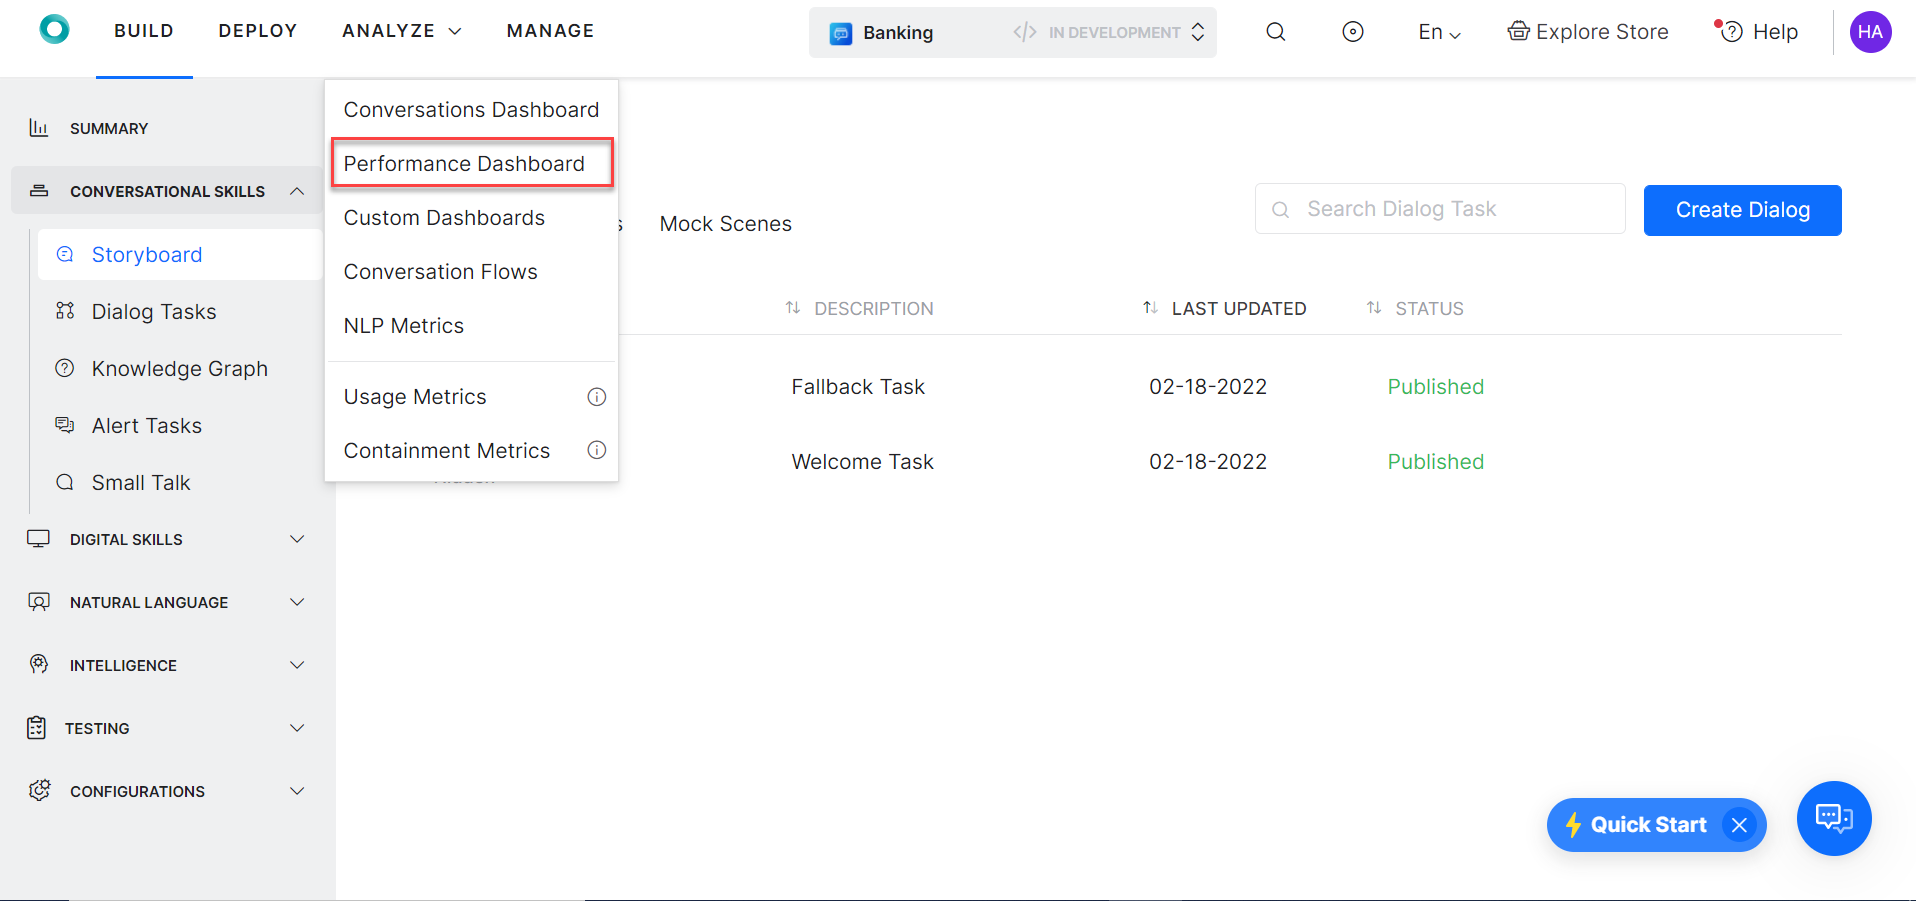
The Performance Dashboard provides insights to understand the virtual assistant’s NLP performance and integration metrics.
The Performance Dashboard is categorized into four categories to identify how a virtual assistant performs. These categories are mentioned below:
Intent Identification Rate
This section of the dashboard provides the information of the number of intents that were classified and unclassified. An intent refers to the goal the customer has in mind when typing in a question or comment. While entity refers to the modifier the customer uses to describe an issue, intent is “What they really mean”. To know more about intents refer here
Below are the widgets that are used to provide insights:
| Metric |
Description |
| Intent Identification Rate |
A scorecard which displays the percentage and the number of intents that were identified in a duration. It also displays the percentage increase or decrease in identifying intents from the last selected period. |
| Intent Identification Trend |
A line chart that displays the total number of intents that were classified by the virtual assistant versus the total number of intents that were unclassified by the virtual assistant over a period of time. |
| Popular Intents |
A table that provides the insights to the number of times an intent was successfully identified from the user utterances. |
| Popular Unidentified Utterances |
A table that displays the number of utterances that did not identify an intent. The utterances are grouped by their similarity. |
Goal Completion Rate
The goal completion metrics provide insights as to how many tasks were completed in a period of time by a virtual assistant. This metrics shows all types of tasks which includes the completed tasks, abandoned tasks, incomplete tasks and failed tasks.
Listed below are the widgets that could help in providing information about these details:
| Metric |
Description |
| Goal Completion Rate |
A scorecard which displays the percentage and the number of task executions that were successfully completed in a duration. It also displays the percentage increase or decrease in completing tasks from the last selected period. |
| Goal Completion Trend |
A line chart that plots the successful and failed task executions over a period of time. |
| Task Performance |
A table that provides insights of the number of successful and failed task executions per task for a selected duration. |
| Failure Point Analysis |
A table that displays the number of times a task has failed at various nodes. |
API Execution Rate
This section of the dashboard provides the information of the number of APIs that were successfully executed and failed. While configuring a dialog task often there are needs to use a Service node that is used to make REST or SOAP requests to a third party web-services. To know more about service nodes refer here.
Below are the widgets that are used to provide information about API performance:
| Metric |
Description |
| API Performance Rate |
A scorecard which displays the percentage and the number of service calls that were executed successfully. It also displays the percentage increase or decrease of APIs that were executed successfully from the last selected period. |
| Service Execution Trend |
A line chart that plots the trend of successful and failed service execution over a period of time. |
| Service Performance |
A table that displays the number of times a service node is executed, their status, and the average response time of executing the API. |
Script Execution Rate
This section of the dashboard provides the information of the number of Scripts that were successfully executed and failed. A Script allows you to write JavaScript code in a dialog task. To know more about script nodes please refer here.
Below are the widgets that are used to provide information about Script performance.
| Metric |
Description |
| Script Performance Rate |
A scorecard which displays the percentage and the number of scripts that were executed successfully. It also displays the percentage increase or decrease of Scripts that were executed successfully from the last selected period. |
| Script Execution Trend |
A line chart that plots the trend of successful and failed script execution over a period of time. |
| Script Performance |
A table that displays the number of times a script node is executed, their status, and the average response time executing the script. |
Filter Criteria
You can filter the data based on the following parameters.
- Date: Filtering the data based on time period in the date filter will display all the conversation sessions that have started in the selected time period. The dashboard displays the data in the local timezone. By default, the dashboard will display past 24 hours data. . By default it is set to GMT timezone. you can change it by selecting the appropriate zone. Below are the filter criterias that could be applied as a date filter.
- 24 Hours – Data aggregated during the immediately preceding 24 hours is displayed. This is the default setting.
- 7 Days – Data aggregated over the past seven days is displayed. The start date is from the day when you selected this filter. For example, If today’s Date is May-17-2022 then selecting the past 7 days will display the record between May-11-2022 to May-17-2022.
- Custom – You can also choose a custom date range to filter the records. You need to choose the start date and end date in the calendar and click on the Select button to filter the records. You can select a maximum of 90 days duration as a filter.
Note: The date format is MMM-DD-YYYY
- Session Type: You can filter based on the Session Type.:
- Interactive sessions – conversations that include one or more messages from the user
- Non-interactive sessions – conversations that do not include any message from the user.
Note: The Developer Interactions are not included in the Session Type filter. Billing session is completely different from the Conversation Session.
- Session Status: You can also filter by Session Status:
- Active Sessions: These are the ongoing conversations where the users are interacting with the virtual assistant.
- Closed Sessions: These are the conversations that are completed between the virtual assistant and the users. To know when a session is considered as closed, click learn more.
- Tag Based: You can filter the dashboard using meta tags added at a message, user, or session level. Multiple tags can be selected under the filter criteria, an ‘and‘ condition will be applied across multiple fields selected for filtering.
The following table gives the widget-wise applicability of meta tags on the dashboard.
| Widget Type |
Session Tags |
User Tags |
Message Tags |
| Successful Tasks |
Applicable |
Applicable |
Not Applicable |
| Sessions |
Applicable |
Applicable |
Not Applicable |
| Messages & Conversation Sessions |
Applicable |
Applicable |
Applicable for Chats |
| Intent Recognized vs. Failed |
Applicable |
Applicable |
Not Applicable |
| Top Tasks |
Applicable |
Applicable |
Not Applicable |
| Top Channels |
Applicable |
Applicable |
Not Applicable |
| Agent Transfer |
Applicable |
Applicable |
Not Applicable |
Performance Dashboard Widgets
The Performance Dashboard metrics are categorized into the following categories:
Intent Identification
The Kore.ai’s NLP engine breaks conversations down to their essence and can identify and follow-up on multiple action items, or intents, from a single message. You can allow the NLP engine to detect and execute intents identified in a single user utterance. By default, this setting is disabled and you can enable it. Learn more.
This widget provides insights on the following intent identification metrics:
- Intent Identification Trend – Displays the percentage of the intents that were identified by the assistant. You can also view the percentage of intents that were not identified by the assistant.
- Utterances identification over time – Displays the identified or unidentified utterances over a period of time.
- Popular Intents Identified – Displays the number of times an utterance was successfully identified. The utterances will be grouped together based on their similarity.
- Popular Unidentified Utterances – Displays the number of times that an utterance was unidentified. The utterances will be grouped together based on their similarity.
Goal Completion
This widget shows the following metrics:
- Goal Completion – Displays the percentage of the tasks that were completed by the assistant.
- Goal Completion Trend – A task can be either completed by using the bot. There could be instances where the user either abandons the assistant in between or reaches an agent node. This graph plots the tasks that are completed or not completed over a period of time.
- Task Performance – Provides insights about the FAQs and dialogs where the assistant has completed the interaction successfully.
- If an FAQ is answered, then it is classified as ‘FAQ Success’
- If a Dialog Task has successfully reached and completed the last node in any of the paths, then it is classified as success.
- Failure Point Analysis – This widget provides insights of where the task failed and how many times it failed. Based on this failure report, you can take necessary measures.
API Execution Rate
This widget shows the trend of successful execution vs failed apis. Also, includes service performance metrics which provide insights on the average execution time, and total count of each service that were executed.
This widget shows the following metrics:
- Services Execution Trend – Displays the percentage of the API services that were executed successfully by the assistant
- Services Executed Over time – Displays all the successfully executed services and failed services over a period of time.
- Service Performance – Displays the count of API services that were successfully executed and the scripts that were failed. You can also see the average execution time for each script.
Script Execution Rate
A Script allows you to write JavaScript code in a dialog task. You can use the script to execute the following actions:
- Manipulate user input parameters before executing an API call.
- Manipulate the parameters from an API response payload before continuing with the dialog.
- Display custom error messages to the user.
- Make decisions based on complex business rules.
For more information, click learn more.
This widget shows the trend of successful execution vs failed scripts.
- Scripts Execution – Displays the percentage of the scripts that were executed successfully by the assistant.
- Script Executed Over Time – Shows all the successfully executed scripts and failed scripts over a period of time.
- Script Performance – Displays the count of scripts that were successfully executed and the scripts that were failed. You can also see the average execution time for each script.