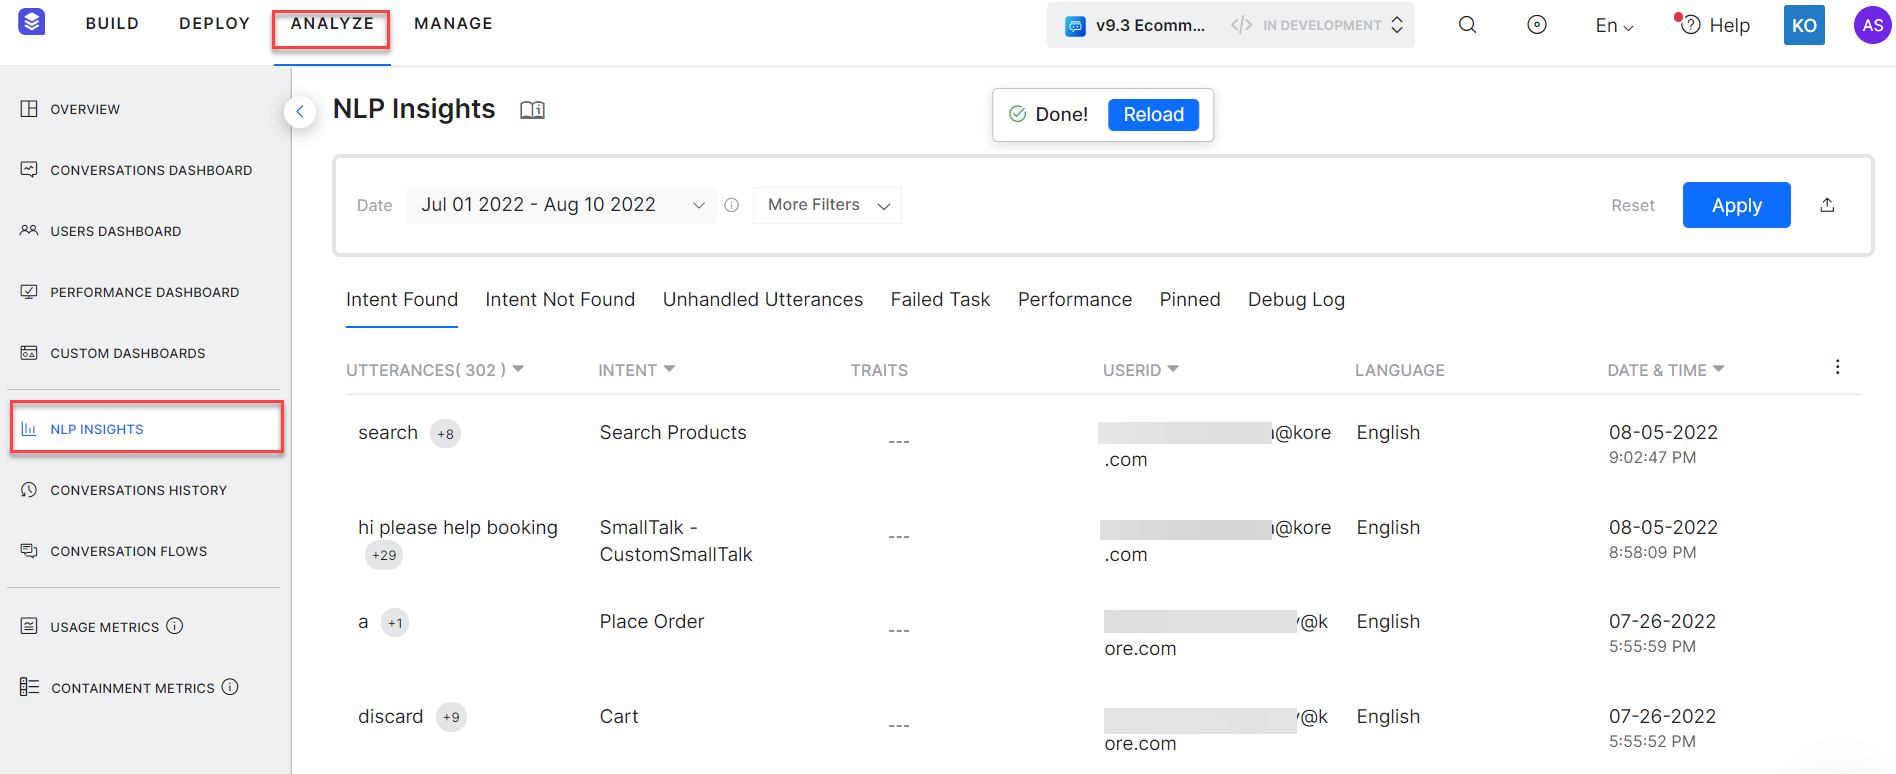
The NLP Insights helps you gain in-depth insights into the analytics data and assess your virtual assistant’s performance in identifying and executing tasks. You can improve your VA’s performance based on the insights.:
The Analyze > NLP Insights page shows the specific information in the following sections:
- Intent Found: Number of identified intents
- Intent Not Found: Number of unidentified intents
- Unhandled Utterances: Number of unhandled utterances
- Failed Task: Number of unsuccessful tasks
- Performance: Monitor all the scripts and API services and capture the number of failed services or scripts during the interactions
- Pinned: Pinned NLP Insight records. Specific records are pinned to highlight them for easy access and viewing.
- Debug Log: Custom Debug logs include user conversations from across all channels, for analyzing your VA.
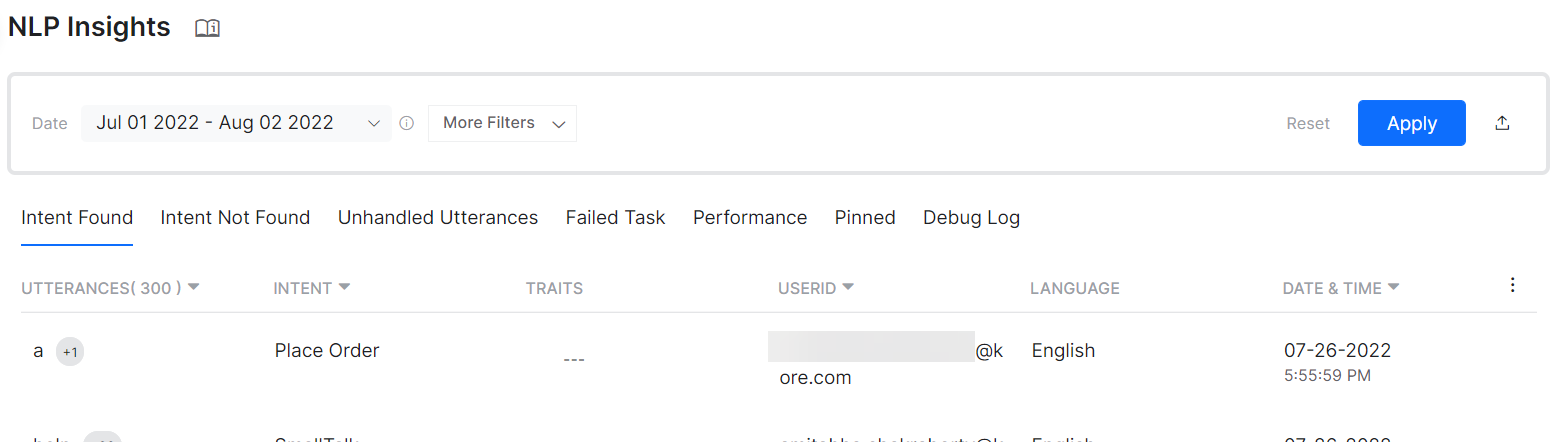
Intent Found
An intent refers to the goal the customer has in mind when typing in a question or comment. The phrases used to express the intent are called user utterances. The Intent Found tab includes all the user utterances identified by the platform.
Note: You need to check for false positives in scenarios where the utterance is wrongly identified for an intent.
See the following table and Features section to know more.
The following is an example of Intent Found:
User: I want to know my order confirmation
VA: Would you like to switch to Track Order
User: Yes
VA: Lets log you in.
How would you like to go ahead – Log in or Guest?
In the above conversation, the user utterance of ‘knowing the order confirmation status’ is recognized by the VA and successfully mapped to the Track Order intent.
Description of the Intent Found Fields
The following table lists the fields on the Intent Fount tab with descriptions:
| Fields |
Description |
| Utterances |
The utterances that are identified by the VA. The details on the tab are grouped by utterances based on the similarity, by default. To turn off grouping by utterance, click the Utterances header and disable the Group by Utterances option. |
| Intent |
The intent/task that is identified. The details on the tab can be grouped by intents. By default, the Group by Intent option is turned off. To turn it on, click the Intent header and enable the Group by Intent option. |
| Traits |
All the traits that are identified for the listed utterances. The details on the tab can be grouped by traits. By default, the Group by Traits option is turned off. To turn it on, click the Traits header and enable the Group by Traits option.
This information is available for the data generated after June 1, 2021. |
| UserID |
The UserID of the end user related to the conversation. You can view the metrics based on either Kore User id or Channel User Id.
Channel-specific ids are shown only for the users who have interacted with the VA during the selected period. |
| Language |
The language in which the conversation occurred.
If it is a multi-lingual VA, you can select specific languages to filter the conversation that occurred in those languages. The page shows the conversations that occurred in all enabled languages by default. |
| Date & Time |
The date and time of the chat. You can sort the data by either Newest to Oldest or Oldest to Newest. |
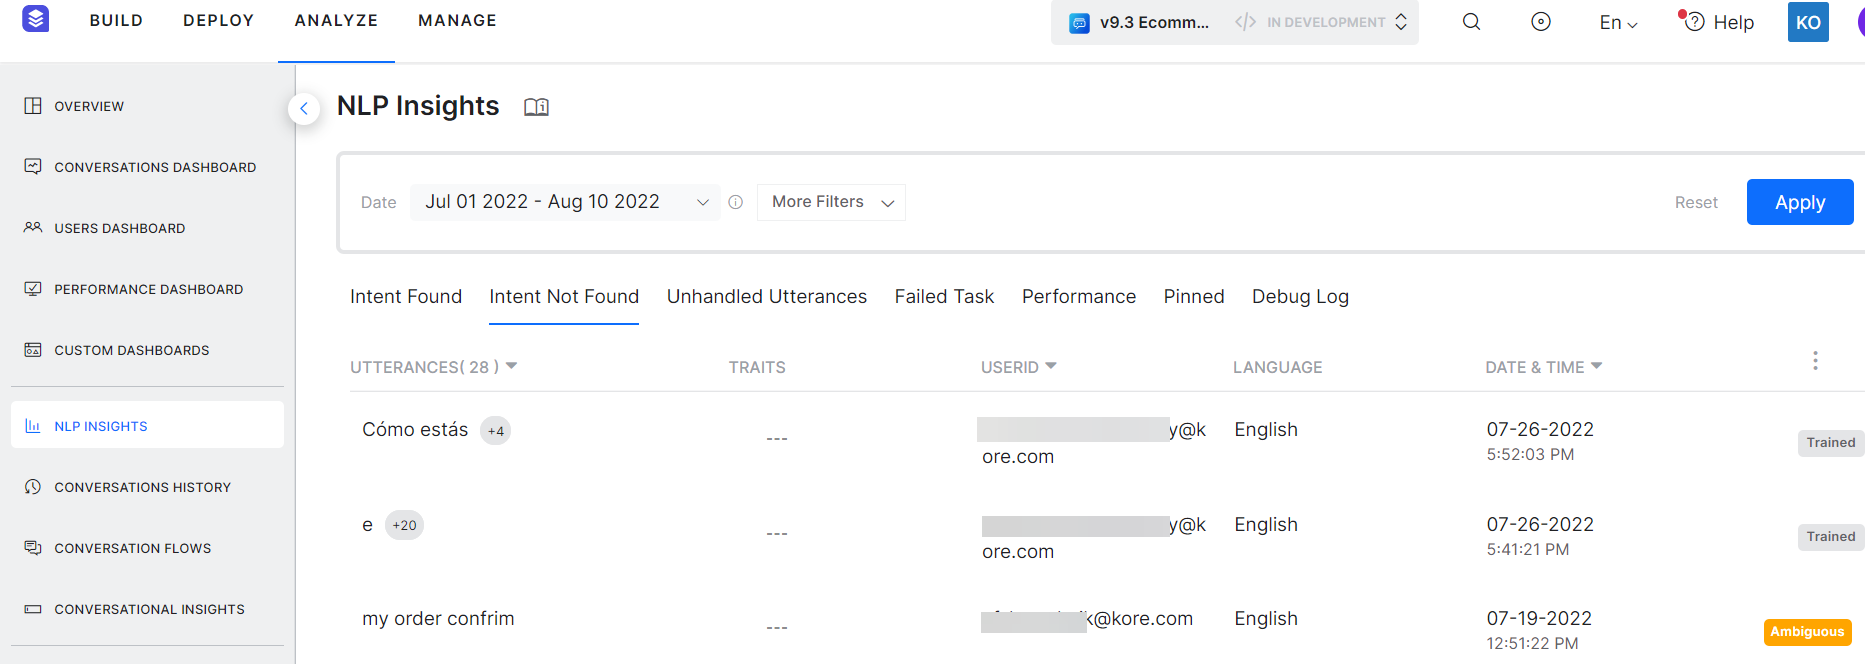
Intent Not Found
Intent Not Found includes all the user utterances that the platform is not able to identify with a dialog task or FAQ either due to invalid training, less training data or the intent unavailability in the virtual assistant.
See the following table and Features section to know more.
Example of Intent Not Found:
User: I want to know my account statement
VA: I’ m sorry, I did not recognize the value you have entered. Please select a value from the list.
In the above conversation, the VA does not recognize the user utterance of ‘knowing the account statement’. It could be due to invalid training, less training, or unavailability of intents in the virtual assistant.
Description of Intent Not Found Fields
The following table lists the fields on the Intent Not Found tab with descriptions:
| Fields |
Description |
| Utterances |
The utterances that are not identified by the VA. The details on the tab are grouped by utterances based on the similarity, by default. To turn off grouping by utterance, click the Utterances header and disable the Group by Utterances option. |
| Traits |
All the traits that are identified for the listed utterances. The details on the tab can be grouped by traits. By default, the Group by Traits option is turned off. To turn it on, click the Traits header and enable the Group by Traits option.
This information is available for data generated after June 1, 2021. |
| UserID |
The UserID of the end user related to the conversation. You can view the metrics based on either Kore User id or Channel User Id.
Channel-specific ids are shown only for the users who have interacted with the VA during the selected period. |
| Language |
The language in which the conversation occurred.
If it is a multi-lingual VA, you can select specific languages to filter the conversation that occurred in those languages. The page shows the conversations that occurred in all enabled languages by default. |
| Date & Time |
The date and time of the chat. You can sort the data by either Newest to Oldest or Oldest to Newest. |
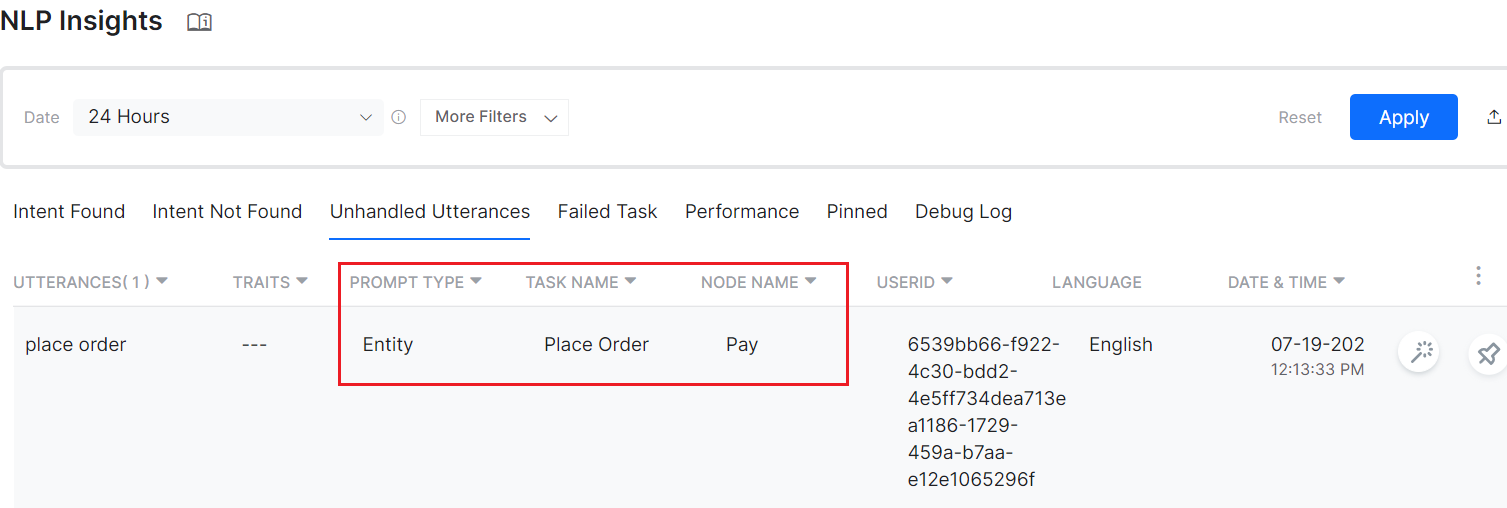
Unhandled Utterances
The Unhandled Utterances help analyze the unidentified inputs received from the users during a task execution at an entity node, message node, or confirmation node. These insights allow you to identify the need for additional training or new intents and enhance the existing NLU model of the VAs.
In an unhandled utterance, the following new fields are available:
- Prompt Type – A prompt type could be either an Entity node, Message node, or a Confirmation node.
- Node Name – Name of the node in which the utterance is not handled
- Task Name – Name of the task in which the utterances are unidentified on an entity, message, or confirmation nodes.
- Group by functionality is available for Utterances, Traits, Prompt Type, Task Name, and Node Name
Note: The unhandled utterances are available for all conversations with product version 9.3 or higher.
See the following table and Features section to know more..
Unhandled Utterance Examples
The following examples show the conversations between the VA and user, with unhandled utterances captured at Entity, Message, and Confirmation nodes.
At an Entity Node:
For example, when the user provides an invalid input at entity or confirmation nodes as follows:
User: I want my account statement
VA: Please enter your Customer Id
User: Where do I find it?
VA: Sorry, that is an incorrect input. Please enter your Customer Id
In the above conversation, if the VA doesn’t recognize “where to find customer id” as an intent or entity, then this utterance is categorized under Unhandled Utterances.
At a Message Node:
For example, when the user provides an invalid input at a message node as follows:
User: I want to book a flight for today
VA: Enter the flight number
User: 12434
VA: Enter number of seats required
User: 3
VA: Your flight is booked. Would you like to:
1. Book a Hotel
2. Book a sightseeing tour
User: I want to Cancel the Flight
VA: I’m sorry, I don’t understand. Please enter again.
In the above conversation, if the VA doesn’t recognize the intent name “cancel flight” as an input at the message node. The intent identification fails and the utterance is categorized under Unhandled Utterances.
At Confirmation Node:
For example, when the user provides an invalid input at a confirmation node as follows:
VA: How may I help you
User: I want to book a flight
VA: Enter the number of seats
User: 2
VA: Please confirm if you want two seats
User: I want to hire a cab
VA: I cannot understand it, can you rephrase it
In the above conversation, when a user enters ‘I want to hire a cab’ at the confirmation node, it is not recognized and logged under Unhandled Utterances.
Description of Unhandled Utterances Fields
The following table lists the fields on the Unhandled Utterances tab with descriptions:
| Fields |
Description |
| Utterances |
The unhandled utterances for which the inputs received are unidentified. The details in the tab are grouped by utterances based on the similarity, by default. To turn off grouping by utterance, click the Utterances header and disable the Group by Utterances option. |
| Traits |
All the traits that are identified for the listed utterances. The details in the tab can be grouped by traits. By default, the Group by Traits option is turned off. To turn it on, click the Traits header and enable the Group by Traits option.
This information is available for analytics generated after June 1, 2021. |
| Prompt Type |
A prompt type could be either an Entity node, Message node, or a Confirmation node. To turn on grouping by Prompt Type, click the Prompt Type header and enable the Group by Prompt Type option. |
| Task Name |
The task that is identified for the user utterance. To turn on grouping by task name, click the Task Name header and enable the Group by Task option. |
| Node Name |
The name of the service or script or WebHook within the task that got executed in response to the user utterance. To turn on grouping by node names to which these scripts or services belong, click the Node Name header and turn on the Group by NodeName option. |
| UserID |
The UserID of the end user related to the conversation. You can view the metrics based on either Kore User id or Channel User Id.
Channel-specific ids are shown only for the users who have interacted with the VA during the selected period. |
| Language |
The language in which the conversation occurred.
If it is a multi-lingual VA, you can select specific languages to filter the conversation that occurred in those languages. The page shows the conversations that occurred in all enabled languages by default. |
| Date & Time |
The date and time of the chat. You can sort the data by either Newest to Oldest or Oldest to Newest. |
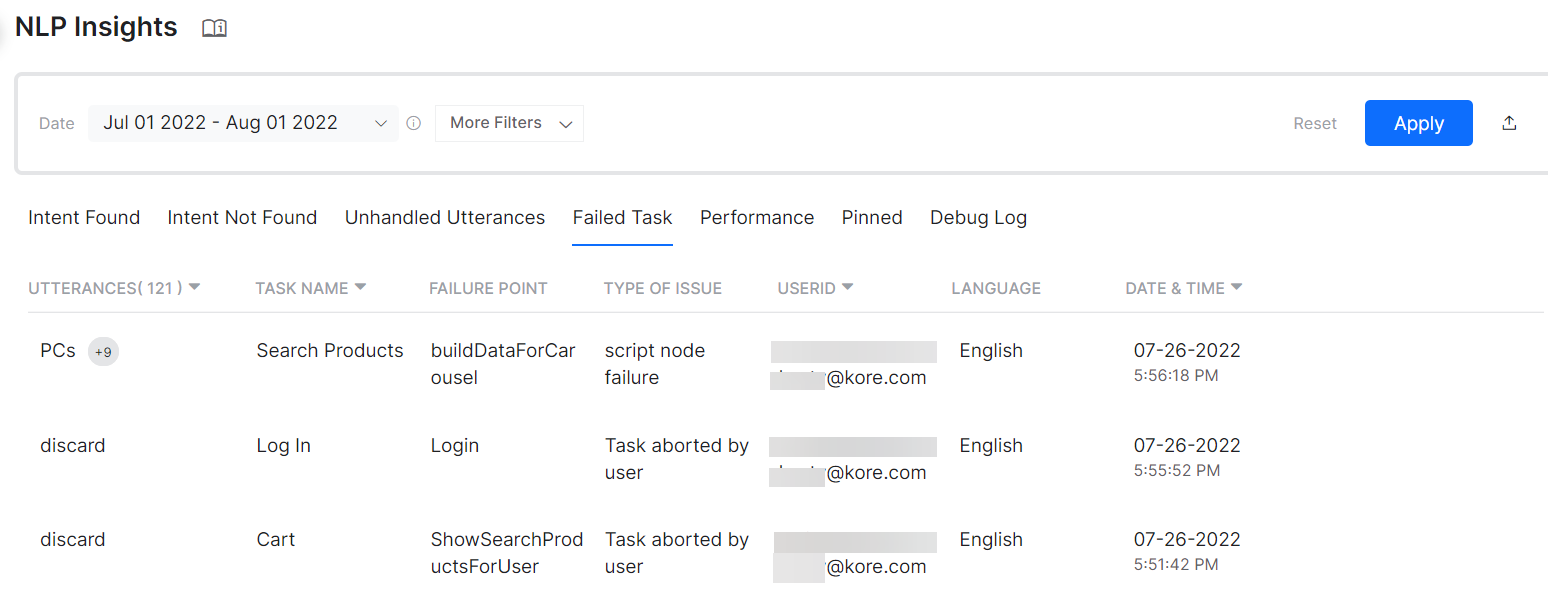
Failed Task
In a scenario where all the user utterances are successfully mapped to an intent, but the task cannot be completed for some reason, then such utterances are listed under this tab. You can group them based on task and failure types to analyze and solve issues with the VA.
See the following table and Features section to know more.
Failed Task – Type of Issues
Different types of issues that occur during a Failed Task are listed as follows:
- Task aborted by user
- Alternate task initiated
- Chat Interface refreshed
- Human agent transfer
- Authorization attempt failure – Max attempts reached
- Incorrect entity failure – Max attempts reached
- Script failure
- Service failure
- Inactivity or External Events (from ver8.0) – when the conversation session and as a result, the in-progress task is closed due to inactivity or external events.
Description of Failed Task Fields
The following table lists the fields on the Failed Task tab with descriptions:
| Fields |
Description |
| Utterances |
The utterances that are successfully mapped to an intent, but still the task failed due to some issue. See Failed Task – Type of Issues for more details. The details in the tab are grouped by utterances based on the similarity, by default. To turn off grouping by utterance, click the Utterances header and turn off the Group by Utterances option. |
| Task Name |
The task that is identified for the user utterance. To turn on grouping by task name, click the Task Name header and enable the Group by Task option. |
| Failure Point |
Nodes or points in the task execution journey where the failure occurred resulting in the task cancellation or user drop. Click an entry to view the complete conversation for that session with markers to identify the intent detection utterance and the failure/drop-out point. Depending on the task type, clicking Failure Point shows more details. |
| Type of Issue |
Shows the reason for failure in case of Task Failure records.
To know the usual type of issues, see Failed Task – Type of Issues. |
| UserID |
The UserID of the end user related to the conversation. You can view the metrics based on either Kore User id or Channel User Id.
Channel-specific ids are shown only for the users who have interacted with the VA during the selected period. |
| Language |
The language in which the conversation occurred.
If it is a multi-lingual VA, you can select specific languages to filter the conversation that occurred in those languages. The page shows the conversations that occurred in all enabled languages by default. |
| Date & Time |
The date and time of the chat. You can sort the data by either Newest to Oldest or Oldest to Newest. |
Performance
Developers can monitor all the scripts and API services across the VA’s tasks from a single window. The performance tab displays information related to the backend performance of the VA. The platform stores the following meta-information:
- Node name, type, and task name
- Total number of runs
- Success %
- The total number of calls with 200 responses and the total number of calls with a non-200 response. You can view the actual response code from the details page that opens when you click the service row
- Average Response times
- Appropriate alerts if a script or a service is failing consecutively
Description of Performance Fields
The following table lists the fields on the Performance tab with descriptions:
| Fields |
Description |
| Node Name |
The name of the service or script or Webhook within the task that got executed in response to the user utterance. To turn on grouping by components to which these scripts or services belong, click the Node Name header and turn on the Group by NodeName option. |
| Type |
Shows whether it is a script or service or Webhook.
Webhook details are included from ver 7.0. |
| Task Name |
The task that is identified for the user utterance. To turn on grouping by task name, click the Task Name header and enable the Group by Task option. |
| Total Runs |
The total number of times within the date period that the script or service is run for any user utterances. |
| Success% |
The percentage of the service or script runs that got executed successfully. |
| 2XX Responses |
The percentage of the service or script runs that returned a 2xx response. |
| Non 2XX Responses |
The percentage of the service or script runs that returned a non-2xx response. |
| Avg Response Time |
The average response time of the script or service in the total number of runs.
This can be sorted from High to Low or Low to High under the Performance tab. |
Pinned
Any records from Identified and Unidentified Intents, Unhandled Utterances, or Failed Tasks tabs that are pinned are displayed in the Pinned tab.
Description of Pinned Fields
The following table lists the fields on the Pinned tab with descriptions:
| Fields |
Description |
| Utterances |
The pinned utterances are displayed here. The details in the tab are grouped by utterances based on the similarity, by default. To turn off grouping by utterance, click the Utterances header and disable the Group by Utterances option. |
| Intent |
The intent associated with the pinned utterance. The details in the tab can be grouped by Intents. By default, the Group by Intent option is turned off. To turn it on, click the Intent header and enable the Group by Intent option. |
| Type of Issue |
Shows the reason for failure in case of Task Failure records.
To know the usual type of issues, see Failed Task – Type of Issues. |
| UserID |
The UserID of the end user related to the conversation. You can view the metrics based on either Kore User id or Channel User Id.
Channel-specific ids are shown only for the users who have interacted with the VA during the selected period. |
| Language |
The language in which the conversation occurred.
If it is a multi-lingual VA, you can select specific languages to filter the conversation that occurred in those languages. The page shows the conversations that occurred in all enabled languages by default. |
| Date & Time |
The date and time of the chat. You can sort the data by either Newest to Oldest or Oldest to Newest. |
Debug Log
Any custom debug statements that you entered in the Script node using the script koreDebugger.log("<debug statement>")are displayed on this tab. Debug statements should be in a string format. See the following table to know more.
The logs include the user conversation from across all channels. You can use them for bot analysis especially in case of failures during user interaction.
The details include:
- The actual statement that you have defined at the time of Bot definition.
- Date and time of logging
- Channel
- User ID (along with channel-specific id)
- Language of interaction
- Task name if available
You can also view the details of the chat history associated with the session. To view more details, follow the below steps:
- Click a logged record.
- On the corresponding window, you can find the Details and Chat History tabs.
- Under the Details tab, you can find the task name, channel, language, and flow.
- Click the Chat History tab. You can find the chat transcript where the log is recorded.
- If the debug log is generated from a VA message, you are navigated to that specific message in the chat transcript.
- If the debug log is not part of the VA message, you are navigated to the latest message added before the debug statement.
For universal bots, the debug statements from the universal and linked bots are included in the logs. The debug logs also include the error messages related to BotKit, for example, when the platform could not reach the BotKit or when the BotKit did not acknowledge the message sent by the platform. The message includes details like the <endpoint>, <error code>, and <response time>.
Description of Debug Log Fields
The following table lists the fields on the Debug Log tab with descriptions:
| Fields |
Description |
| Log |
Description of the debug log. For example, getIndex is not defined. |
| Task Name |
The task that is identified for the user utterance. To turn on grouping by task name, click the Task Name header and enable the Group by Task option. |
| Debug Point |
The point or a node in the conversation where the error is identified. For example, buildDataForCarousel |
| Channel |
Specific channel where the conversation occurred. |
| Language |
The language in which the conversation occurred.
If it is a multi-lingual VA, you can select specific languages to filter the conversation that occurred in those languages. The page shows the conversations that occurred in all enabled languages by default. |
| UserID |
The UserID of the end user related to the conversation. You can view the metrics based on either Kore User id or Channel User Id.
Channel-specific ids are shown only for the users who have interacted with the VA during the selected period. |
| Date & Time |
The date and time of the chat. You can sort the data by either Newest to Oldest or Oldest to Newest. |
Storage Limitations
The platform imposes restrictions on the number of log statements retained per VA. The limit is a combination of volume and period:
- Only the latest 700 statements per VA are stored.
- Statements older than 7 days are removed.
NLP Insights Analysis
The following sections describe more about the options available on the NLP Insights page.
Features
The following list details the features available in NLP Insights for Intent Found, Intent Not Found, Unhandled Utterances, and Failed Task.
- You can filter the information based on various criteria such as User Utterances, Intent, user id (Kore user id or channel-specific unique id), date-period, the channel of use, language, etc. You can also filter records based on multiple custom tags. See Filter Criteria to know more.
- Complete meta information is stored for later analysis, including the original user utterance, the channel of communication, entities extracted (if any), custom tags applied, detailed NLP analysis with scores returned from each engine, and the ranking and resolver scores.
- Ability to view the chat transcript to the point of the user utterance. This also gives the option to view the user profile and the details for that user’s conversation sessions.
- You have an option to train the utterance. The utterance will be marked once trained.
- Any important record you want to mark, track later, or both can be pinned. They l appear on the Pinned tab.
- Sorting feature is available for Date and Time (Oldest to Newest, Newest to Oldest). You can export the insights data as a CSV file.
Note: The NLP Insights page shows the conversations from the last 24 hours by default. You can filter the insights for a selected period – use the Date drop-down to select 24 hours, last 7 days, or a custom period.
Fields Matrix
The following matrix shows the availability of fields on each tab of NLP Insights:
| Fields |
Intent Found |
Intent Not Found |
Unhandled Utterances |
Failed Tasks |
Performance |
Pinned |
Debug Log |
| Utterances |
✔ |
✔ |
✔ |
✔ |
X |
✔ |
X |
| Intent |
✔ |
X |
X |
X |
X |
✔ |
X |
| Traits |
✔ |
✔ |
✔ |
X |
X |
X |
X |
| UserID |
✔ |
✔ |
✔ |
✔ |
X |
✔ |
✔ |
| Language |
✔ |
✔ |
✔ |
✔ |
X |
✔ |
✔ |
| Date & Time |
✔ |
✔ |
✔ |
✔ |
X |
✔ |
✔ |
| Prompt Type |
X |
X |
✔ |
X |
X |
X |
X |
| Task Name |
X |
X |
✔ |
✔ |
✔ |
X |
✔ |
| Node Name |
X |
X |
✔ |
X |
✔ |
X |
X |
| Failure Point |
X |
X |
X |
✔ |
X |
X |
X |
| Type of Issue |
X |
X |
X |
✔ |
X |
✔ |
X |
| Type |
X |
X |
X |
X |
✔ |
X |
X |
| Total Runs |
X |
X |
X |
X |
✔ |
X |
X |
| Success% |
X |
X |
X |
X |
✔ |
X |
X |
| 2XX Responses |
X |
X |
X |
X |
✔ |
X |
X |
| Non 2XX Responses |
X |
X |
X |
X |
✔ |
X |
X |
| Avg Response Time |
X |
X |
X |
X |
✔ |
X |
X |
| Log |
X |
X |
X |
X |
X |
X |
✔ |
| Debug Point |
X |
X |
X |
X |
X |
X |
✔ |
| Channel |
X |
X |
X |
X |
X |
X |
✔ |
Filter Criteria
You can filter the information on the Insights page using various filters. You can save the entered filter criteria and set it as the default filter using Save as Default Filter.
The filter criteria differ slightly between different tabs. The relevant filters are applied when you switch between the tabs on the Insights Page. See Dashboard Filter Criteria to know more details.
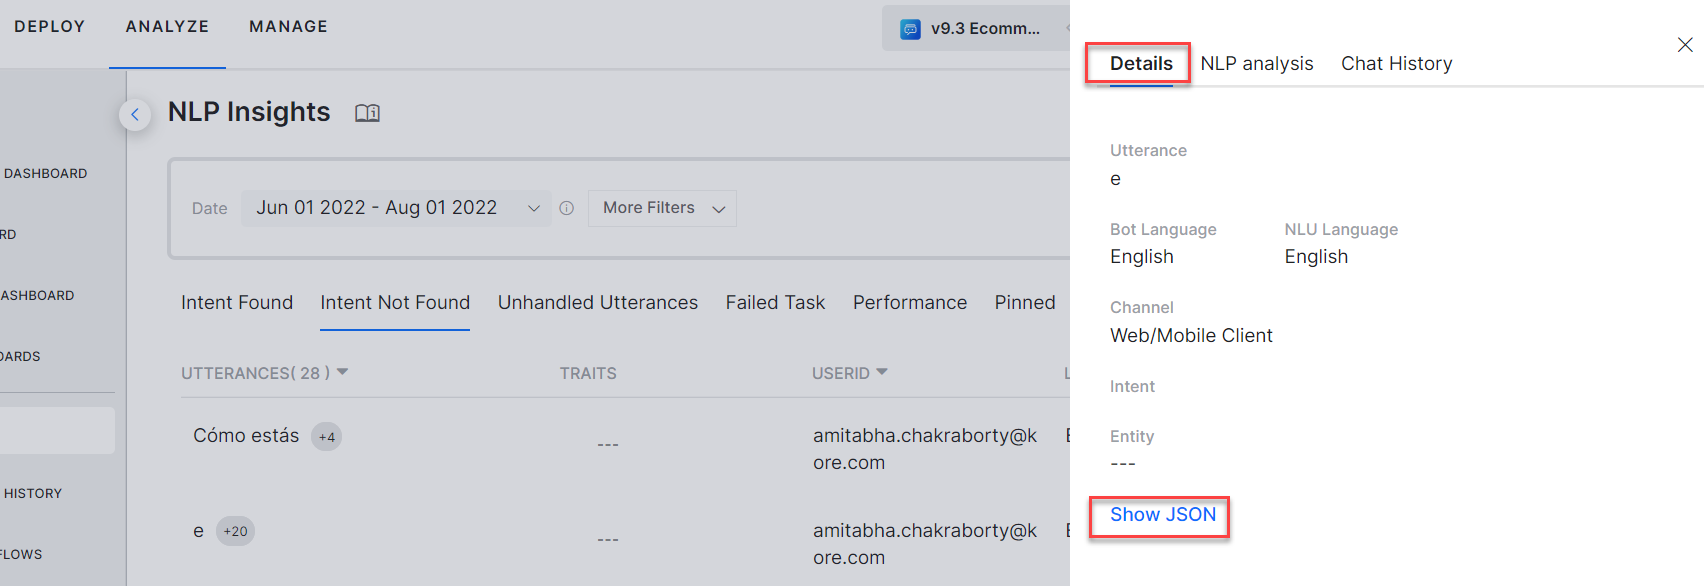
Detailed View
For all the user utterances listed on the various tabs such as Intent Found, Intent Not Found, Unhandled Utterances, etc., you can open more details of the user session by clicking the respective record. The record shows the information on the following sub-tabs: Details, NLP Analysis, and Chat History.
Details
The Details tab shows the basic details of the session along with a JSON file that includes the NLP analysis for the conversation.
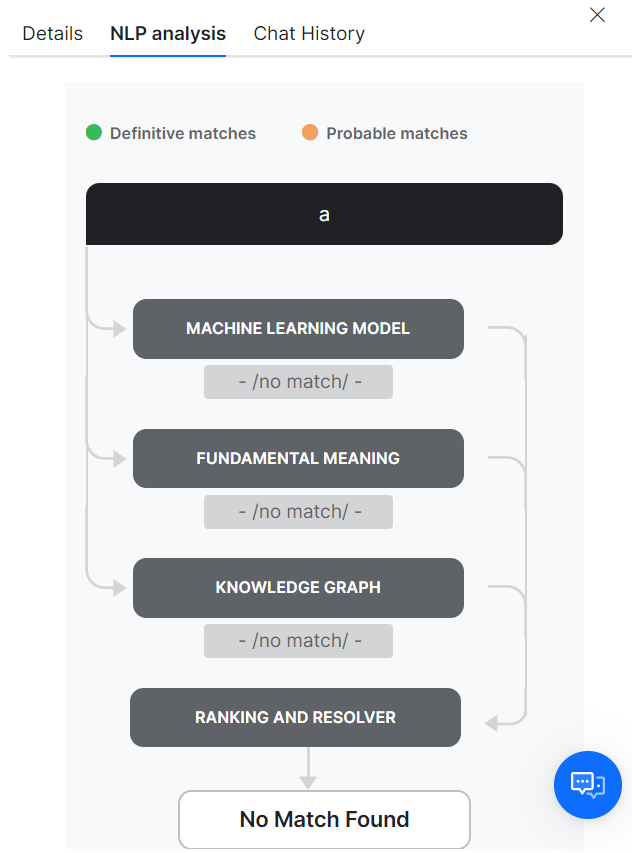
NLP Analysis
This tab provides a visual representation of the NLP analysis, including intent scoring and selection. See Testing and Training a Bot and Ranking and Resolver for more information.
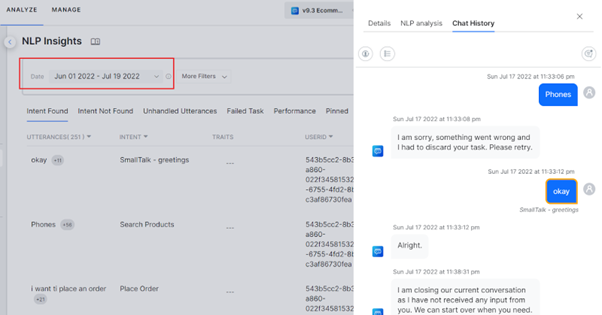
Chat history
On the Chat History tab, you can access the exact message or conversation for which the record is logged. It shows the entire chat history of the user session.
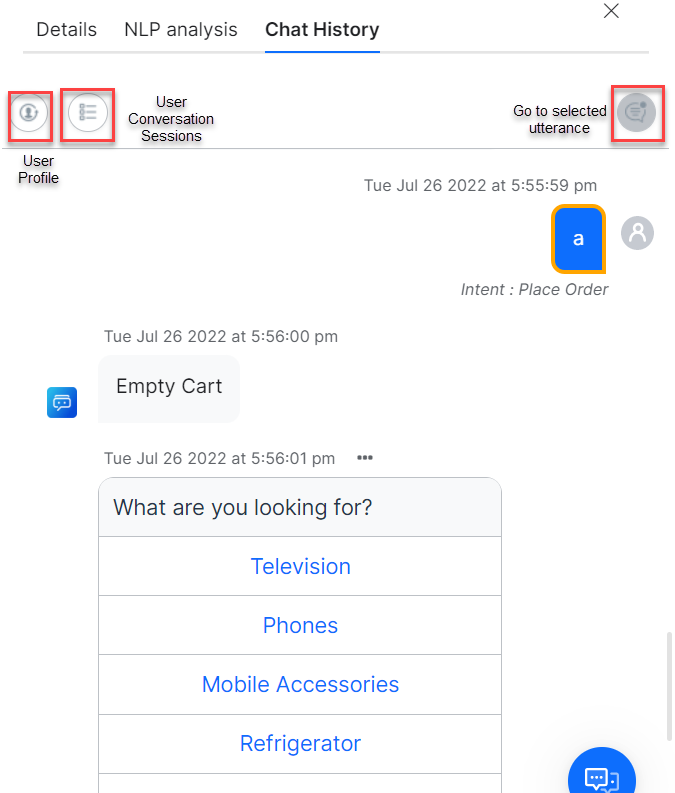
Chat History provides visibility into the user information by capturing the following details:
- User Profile: Provides a 360-degree view of the user and their usage metrics.
- User Conversation Sessions: Lists all the sessions of the user in the given period with the selected utterance section expanded.
- Go to Selected Utterance: When you click this icon, the selected utterance is highlighted in orange (see the preceding screenshot).
The following user information details are displayed on the Chat History tab:
| Functionality |
Attribute |
Description |
| User Profile |
Kore User ID |
User id assigned by the platform |
| Channel Data |
Data received from the channel, that is the information available in the User Context. |
| User Meta Tags |
The total number of meta tags associated with the user and key-value pairs for the most recent ones. |
| Latest Interaction |
Last time the user interacted with the VA. |
| Total Conversation Sessions |
The total number of interactive and non-interactive sessions registered by the user from the beginning of time. |
| Total Conversation Sessions in the Last 30 Days |
The total number of interactive and non-interactive sessions registered by the user in the last 30 days. |
| *The next few attributes are not displayed if there is no interaction by the user in the last 30 days |
| Last 30 Days’ Intent Detection Rate |
(Total identified intents / (Total identified intents + unidentified utterances)) * 100 for the utterances over the last 30 days |
| Intents Requested |
Total identified intents + unidentified utterances |
| Intents Identified |
Total intents identified |
| Last 30 Days Goal Completion Rate |
(Tasks success tasks / (Total success tasks + total failed tasks) ) * 100 for the tasks over the last 30 days |
| Tasks Initiated |
Total success tasks + total failed tasks |
| Tasks Completed |
Tasks successfully completed |
| Recent Conversation Flows |
Top 10 popular conversation flows executed by the user in the last 30 days. Popular flows are determined by the number of instances, for which the conversation flow is executed. |
| User Conversation Sessions |
Session Attributes |
| Session Start |
Session start date and time. |
| Session End |
Session end date and time. |
| Channel |
Channel in which the session is initiated. |
| Agent Transfer Tag |
The session where the user is transferred to an agent. Sessions should be considered even if the user returns to the VA. |
| Drop Off Tag |
The session where the user dropped off. |
| Total Success Tasks |
Count of tasks successfully completed in the session. |
| Total Failed Tasks |
Count of tasks failed in the session. |
| Intents Identified |
Count of intents successfully identified in the session. |
| Intents Unidentified |
Count of intents unidentified in the session and list of unidentified intents. |
| Conversation Path |
The series of tasks initiated by the user in the session. |
| Session Meta Tags |
Count of the session meta tags used with the details of the most recent custom meta tags displayed. |
| Conversation Transcript |
| Message Meta Tags |
The chat transcript is annotated with message tags for messages with meta-tags associated with them. |
| Agent Transfer |
Indicates the point of agent transfer at the last message before transfer. |
| Drop Off |
Indicate the point of drop off at the last message before dropping off. |
Advanced Performance Details
Clicking a service or script or WebHook name opens the advanced details dialog for the service, which lists each instance of its run along with separate tabs for successful and failed runs. Analyzing the average response time of different runs gives you insights into any aberrations in the service or script execution. Click any row to open the JSON response associated with the service or script run.
Train the Bot
You can train the specific intents and utterances from the Intent Found, Intent Not Found, and Unhandled Utterances tabs. To do so, hover over a row in any of these tabs, and click the Train icon. It opens the Test & Train page, where you can train the bot. For more information, see Testing and Training a Bot.
Data Export
You can export the data present on the NLP Insights page to a CSV file, by clicking the Export icon on the top right corner of the page.
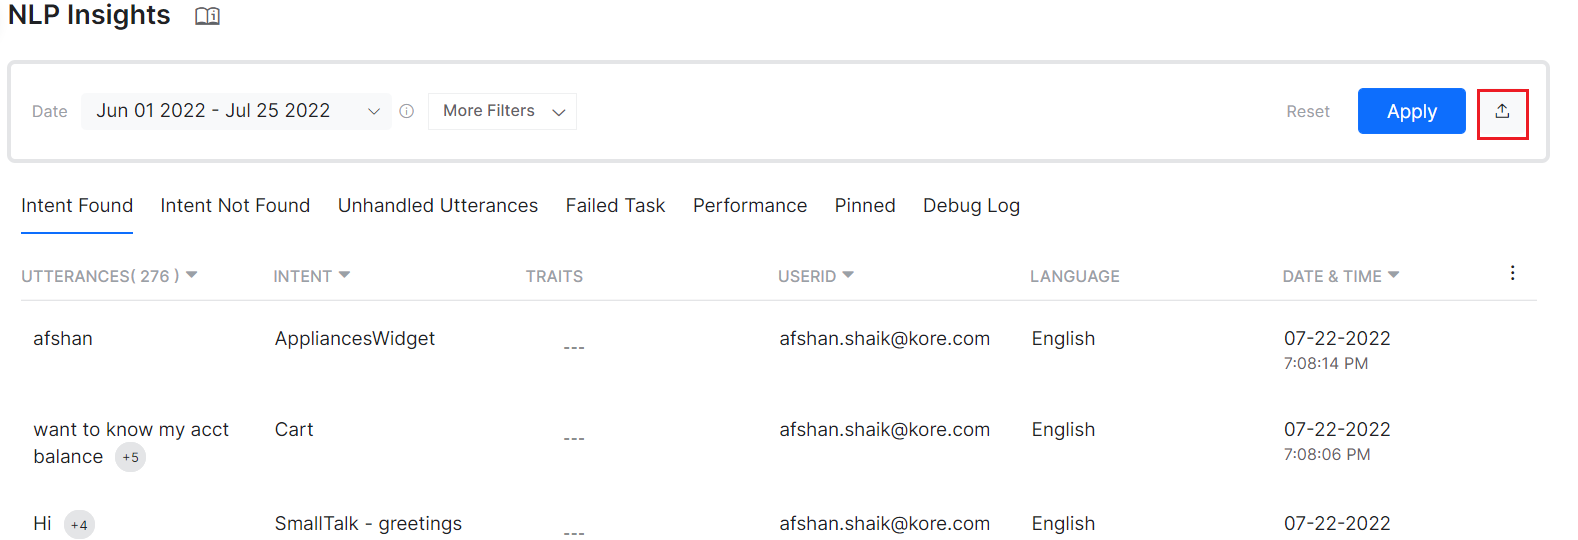
Once you click the icon, the export process starts, and you can see the progress in the Status Tracker dock. The export file is downloaded to your local Downloads folder. The downloaded file has the information specific to the selected tab and the detailed analysis based on the selected filters.
These records also include the Meta Tag information.
 분석 > NLP 지표 섹션에는 다음과 같은 섹션이 포함되어 있습니다.

