일부 작업의 경우 메시지에 비해 너무 큰 데이터가 포함되어 있으면 사용자에게 보낼 메시지에 링크를 추가해야 합니다. 예: 그림, 초록 및 전체 기사 또는 보고서 링크가 있는 메시지. 이 항목에서는 관련 데이터 그룹 집합을 표시하는 그룹별 카드 레이아웃 보고서를 정의하는 방법을 설명합니다. 예: 주간 약속 일정표 요약. 메시지에서 이 보고서 유형의 URL을 클릭할 때 최종 사용자에게 그룹별 카드 레이아웃 보고서 유형을 표시할 수 있습니다. 다음 그림에서 최종 사용자에게 전송된 메시지에는 내 주간 일정표 요약이라는 그룹별 카드 레이아웃 보고서에 대한 링크가 포함되어 있습니다. 메시지에는 요약 보고서의 제목이 포함되지만 상세 데이터는 포함되지 않습니다. 그룹별 일정표 보고서 
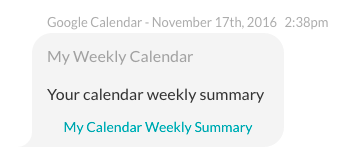
사용자가 메시지에서 링크를 클릭하면 내 주간 일정표 요약 보고서의 다음 그림과 같이 카드 헤더, 선택적 카드 설명, 헤더 행이 있는 자세한 그룹화된 항목 목록을 제공하는 그룹별 카드 레이아웃 보고서가 다음 주에 예정된 약속 일정의 목록으로 표시됩니다. 보고서에 Group By 사용 
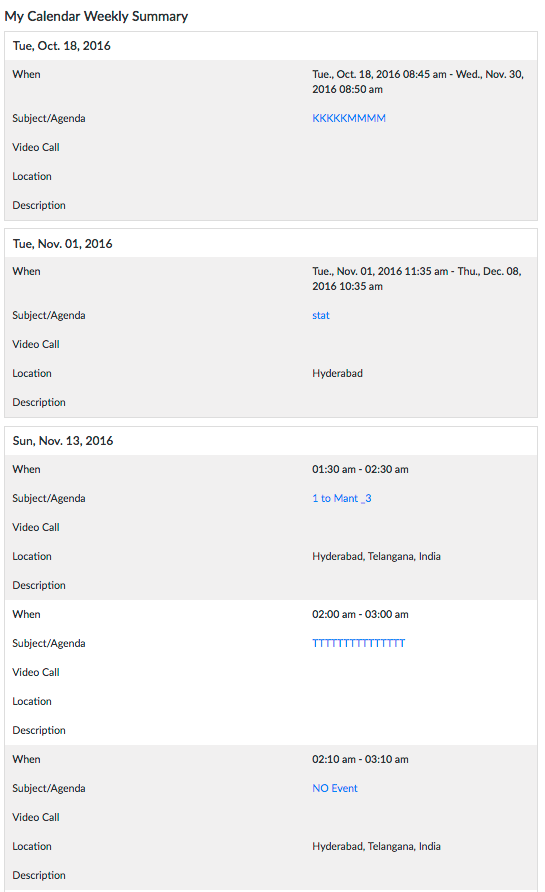
그룹별 카드 레이아웃 보고서 정의 방법 다음 절차를 완료하려면, 경고 작업 또는 정보 작업 등과 같은 그룹별 카드 레이아웃 보고서 링크를 추가하려는 작업을 먼저 정의해야 합니다. 그룹별 카드 레이아웃 보고서를 정의하려면 다음 절차의 단계를 완료하세요.

  1. 봇 빌더에서 그룹별 카드 레이아웃 보고서 링크를 추가할 봇의 작업을 선택하세요.

    참고: 게시되지 않은 작업만 수정할 수 있습니다.

  2. 설정 아이콘을 클릭한 다음 편집을 클릭합니다.
  3. 그룹별 카드 레이아웃 보고서를 추가할 작업의 봇 응답 탭에서 보고서 템플릿 정의 섹션의 확장 아이콘을 클릭합니다.
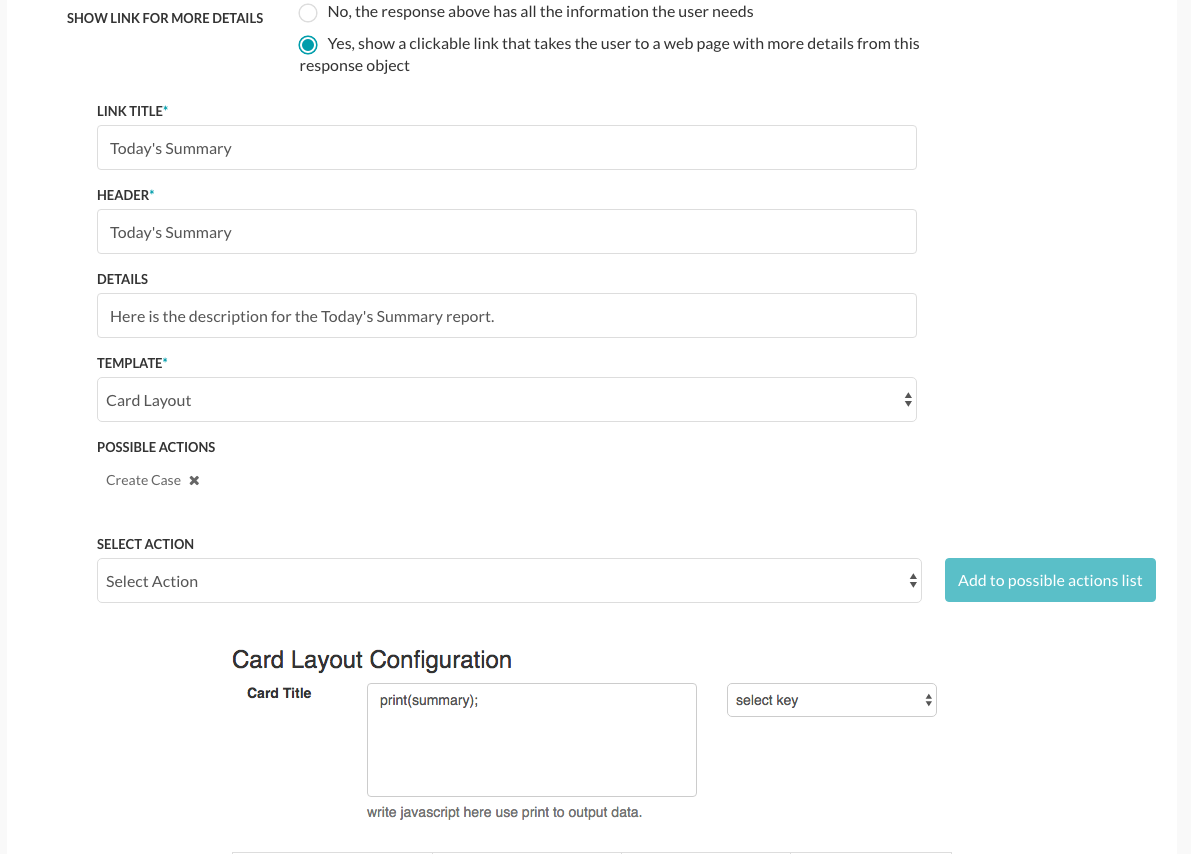
  4. 링크 제목 필드의 작업 게시물에서 최종 사용자에게 표시할 링크 텍스트를 입력합니다. 예: 내 주간 일정표 요약.
  5. 헤더 필드에서 테이블 보고서가 최종 사용자에게 표시될 때 보고서 제목을 입력합니다. 예: 내 주간 일정표 요약.
  6. 세부 정보 필드에서 보고서의 헤더 바로 아래에 표시되는 최종 사용자 도움말 정보를 선택적으로 입력합니다. 예: 오늘의 요약 카드 레이아웃 보고서에 대한 설명 세부 정보는 다음과 같습니다.
  7. 템플릿 드롭다운 목록에서 그룹별 카드 레이아웃을 선택합니다.
  8. 템플릿 편집을 클릭합니다. 카드 레이아웃 설정 대화 상자가 표시됩니다.
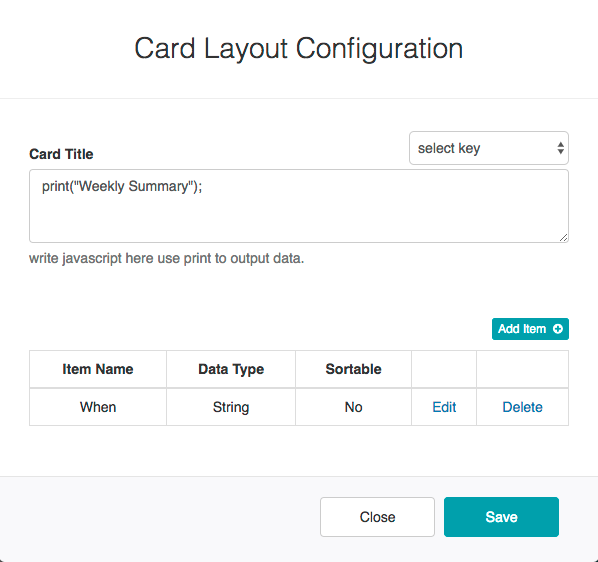
  9. 카드 제목 텍스트 영역에는 카드의 제목 데이터(예: print("Today's Summary Report"); 등 정적 제목)를 표시하려면 맞춤형 JavaScript를 입력합니다. 또는 페이로드 키를 사용할 수 있습니다. 예: print(summary);
  10. 항목 추가를 클릭합니다. 열 설정 대화 상자가 다음 그림과 같이 표시됩니다.그룹별 카드 레이아웃 - 항목 설정 대화 상자
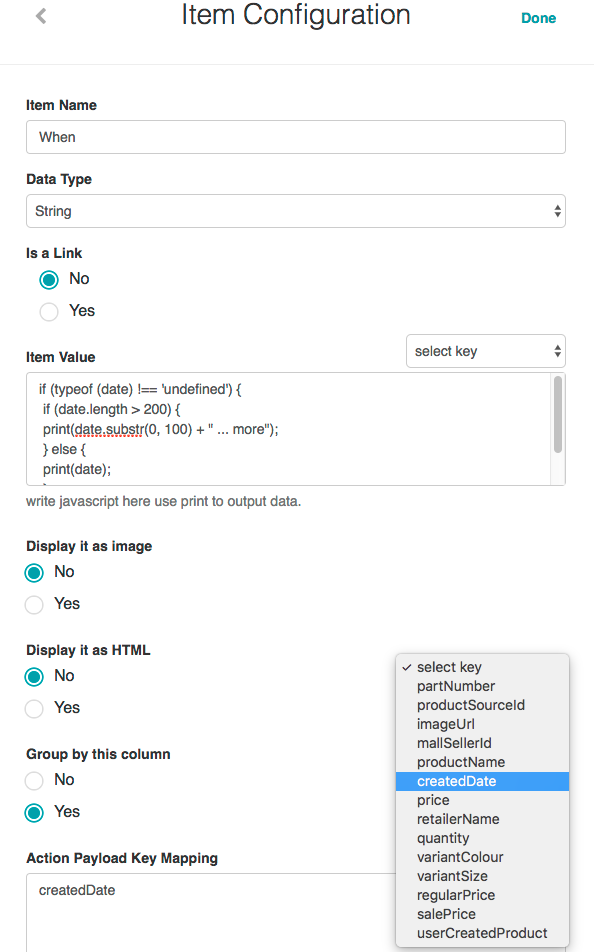
  11. 항목 이름 필드에는 첫 번째 열 제목(예: 시기)을 입력합니다.
  12. 데이터 유형 필드에는 열에 표시되는 정보에 대하여 다음 데이터 유형 중 하나를 선택합니다.
    1. 문자열
    2. 숫자
    3. 날짜
  13. 열의 데이터가 하이퍼링크인 경우 링크 여부를 사용합니다. 사용하는 경우:
    1. 링크 레이블 필드에는 링크의 텍스트를 표시하려면 JavaScript를 입력합니다. 예: print(date);.
    2. URL 값 필드에는 링크 레이블을 클릭할 때 출력 데이터를 표시하려면 JavaScript를 입력합니다. 예: print("https://login.salesforce.com/" + date);
  14. 링크 여부를 사용 안 함으로 설정한 경우 항목 값 텍스트 영역에 열 값을 표시하려면 JavaScript를 입력합니다. 예:
    if (typeof (date) !== 'undefined') {
     if (date.length > 200) {
     print(date.substr(0, 100) + " ... more");
     } else {
     print(date);
     }
    }
  15. 이미지로 표시 섹션에서 열 값이 이미지인 경우 를 선택합니다.
  16. HTML로 표시 섹션에서 열 값에 HTML 내용이 포함된 경우 를 선택합니다.
  17. 이 열로 그룹화 섹션에서 보고서 항목을 이 항목으로 그룹화하려면 를 클릭합니다.
  18. 조치 페이로드 키 매핑 필드에서 조치 응답 키(예: createdDate)를 이전 그림에 표시된 대로 최종 사용자에게 항목 시기로 표시되는 항목 값 필드로 매핑함으로써 응답 키를 링크로 표시할 수 있습니다.
  19. 완료를 클릭합니다. 카드 레이아웃 설정 대화 상자가 다음 그림과 같이 열이 새로 추가된 채로 표시됩니다. 그룹별 카드 레이아웃 보고서 - 카드 레이아웃 설정 대화 상자
  20. 보고서의 각 추가 열에 대해 10~19단계를 반복하고 저장을 클릭하여 열 설정을 저장한 다음 닫기를 클릭합니다.
  21. 보고서 템플릿 정의 섹션에서 저장을 클릭하여 그룹별 레이아웃 보고서를 저장합니다.

테이블이 저장되었습니다 응답 데이터가 성공적으로 저장됨 메시지가 페이지 상단에 표시됩니다.

一部のタスクでは、ユーザーに送信される、メッセージに対して大きすぎるデータを含むメッセージに、リンクを追加したい場合があります。例えば画像、抽象、および記事全文またはレポートへのリンクなどを含むメッセージです。このトピックでは、毎週の予定カレンダーのサマリなど、データグループの関連セットを表示する、レポート別のカードレイアウトレポートを定義する方法について説明します。
このグループ別のカードレイアウトレポートのタイプは、メッセージ内でこのレポートタイプのURLがクリックされると、エンドユーザーに表示されます。以下の図では、エンドユーザーに送信されたメッセージにカレンダーの週間サマリというグループ別のカードレイアウトレポートへのリンクが含まれています。メッセージにはサマリレポートのタイトルは含まれていますが、詳細データは含まれていません。
Group By Calendar Report
ユーザーがメッセージ内のリンクをクリックすると、次の週に予定されているカレンダーの予定一覧としてのカレンダーの週間サマリレポートの以下の図に示すように、カードヘッダー、任意のカードの説明、およびヘッダーの行とともにグループ化された項目の詳細一覧を含む、グループ別のカードレイアウトレポートが表示されます。
Using Group By for the Report
グループ別のカードレイアウトレポートを定義する
以下の手順を完了するには、グループ別のカードレイアウトレポートへのリンクを追加するアラートタスクや情報タスクなどのタスクをすでに定義している必要があります。グループ別のカードレイアウトレポートを定義するには、以下の手順内のステップを完了します。

  1. Botビルダーで、グループ別のカードレイアウトレポートのリンクを追加するBotのタスクを選択します。

    注:未公開のタスクのみ変更可能です。

  2. 設定アイコンをクリックし、編集をクリックします。
  3. グループ別のカードレイアウトレポートを追加するタスクのBotの応答タブで、展開アイコンをクリックして、レポートのテンプレートの定義セクションを表示します。
  4. リンクタイトルフィールドに、タスク投稿でエンドユーザーに表示するリンクテキストを入力します(例:カレンダーの週間サマリ)。
  5. ヘッダーフィールドには、テーブルレポートがエンドユーザーに表示された際に表示される、レポートのタイトルを入力します(例:カレンダーの週間サマリレポート)。
  6. 詳細フィールドには、レポートのヘッダー直下に表示されるエンドユーザーヘルプ情報を任意で入力します(例:本日のまとめのカードレイアウトレポートの詳細説明はこちらです)。
  7. テンプレートドロップダウンリストで、グループ別のカードレイアウトを選択します。
  8. テンプレートを編集をクリックします。カードレイアウトの設定ダイアログが表示されます。
  9. カードタイトルテキストエリアに、カードのタイトルデータを表示するためのカスタムJavaScriptを入力します(例:print("Today's Summary Report");などの静的タイトル、あるいはprint(summary);などのペイロードキーを使用することもできます)。
  10. 項目を追加をクリックします。下図のように項目の設定ダイアログが表示されます。
    Card Layout with Group By - Item Configuration Dialog
  11. 項目名フィールドに、最初の列のタイトルを入力します(例:いつ)。
  12. データタイプフィールドで、列に表示される情報として以下のデータタイプのいずれかを選択します。
    1. 文字列
    2. 日付
  13. 列内のデータがハイパーリンクの場合、リンクを有効にします。有効にした場合:
    1. リンクラベルフィールドに、リンク用のテキストを表示するJavaScriptを入力します(例:print(date);)。
    2. URLの値フィールドに、リンクラベルがクリックされた場合に出力するデータを表示するJavaScriptを入力します(例:print("https://login.salesforce.com/" + date);)。
  14. リンクが有効になっていない場合は、項目の値テキストエリアに列の値を表示するJavaScriptを入力します。例えば:
    if (typeof (date) !== 'undefined') {
     if (date.length > 200) {
     print(date.substr(0, 100) + " ... more");
     } else {
     print(date);
     }
    }
  15. 画像として表示するセクションで、列の値が画像の場合ははいを選択します。
  16. HTMLとして表示するセクションで、列の値にHTMLコンテンツが含まれている場合ははいを選択します。
  17. この列でグループ化セクションで、レポート項目をこの項目でグループ化する場合ははいをクリックします。
  18. アクションペイロードキーのマッピングフィールドで、上の図に示すように、エンドユーザーに項目のいつとして表示される項目の値フィールドに、createdDateなどのアクション応答キーをマッピングすることで、応答キーをリンクとして表示することができます。
  19. 完了をクリックします。カードレイアウトの設定ダイアログは、以下の図のように新しい列が追加されて表示されます。
    Card Layout with Group By Report - Card Layout Configuration DIalog
  20. ステップ10~19をレポートに列を追加するごとに繰り返し、保存をクリックして列の設定を保存し、閉じるをクリックします。
  21. レポートテンプレートの定義セクションで、保存をクリックして、グループ別のカードレイアウトレポートを保存します。

ページ上部に応答データは正常に保存されましたというメッセージの表示とともに、表は保存されます。

With some tasks, you may want to add a link to a message sent to a user that contains data too large for a message, for example, a message with a picture, abstract, and a link to a full article or report. This topic describes how to define a card layout with group by report that displays a related set of data groups, for example, a weekly appointment calendar summary.
The card layout with group by report type can be displayed to an end-user when the URL for this report type is clicked in a message. In the following illustration, the message sent to the end-user contains a link to the card layout with group by report called My Calendar Weekly Summary. The message contains the title of the summary report, but not the detailed data.
Group By Calendar Report
When the user clicks the link in the message, a card layout with group by report is displayed with a detailed list of grouped items with a card header, optional card description, and a header row as shown in the following illustration for the My Calendar Weekly Summary report as a list of calendar appointments scheduled for the upcoming week.
Using Group By for the Report
To define a card layout with group by report
To complete the following procedure, you must have already defined a task, such as an alert task, or information task, that you want to add a card layout with group by report link to. Complete the steps in the following procedure to define a card layout with group by report.

  1. In Bot Builder, select the task for the Bot that you want to add a card layout with group by report link to.

    Note: Only unpublished tasks can be modified.

  2. Click the Settings  icon, and then click Edit.
  3. On the Bot Response tab for the task that you want to add a card layout with group by report to, click the Expand  icon for the Report Template Definition section.
  4. In the Link Title field, enter the link text to display to the end-user in the task post, for example, My Calendar Weekly Summary.
  5. In the Header field, enter the title of the report to display when the table report is displayed to the end-user, for example, My Calendar Weekly Summary Report.
  6. In the Details field, optionally enter any end-user help information displayed directly below the Header in the report, for example, Here are the description details for my Today’s Summary card layout report.
  7. In the Template drop-down list, select Card Layout With Group By.
  8. Click Edit Template. The Card Layout Configuration dialog is displayed.
  9. In the Card Title text area, enter your custom JavaScript to display the title data for your card, for example, a static title such as print("Today's Summary Report"); or you can use payload keys, for example, print(summary);.
  10. Click Add Item. The Item Configuration dialog is displayed as shown in the following illustration.
    Card Layout with Group By - Item Configuration Dialog
  11. In the Item Name field, enter the first column title, for example, When.
  12. In the  Data Type field, select one of the following data types for the information displayed in the column:
    1. String
    2. Number
    3. Date
  13. Enable Is a link if the data in the column is a hyperlink. When enabled:
    1. In the Link Label field, enter the JavaScript to display the text for the link, for example, print(date); .
    2. In the URL Value field, enter the JavaScript to display the data to output when the Link Label is clicked, for example, print("https://login.salesforce.com/" + date);
  14. If Is a link is not enabled, then enter the JavaScript to display the value for the column in the Item Value text area, for example,
    if (typeof (date) !== 'undefined') {
     if (date.length > 200) {
     print(date.substr(0, 100) + " ... more");
     } else {
     print(date);
     }
    }
  15. In the Display it as an image section, select Yes if the column value is an image.
  16. In the Display it as HTML section, select Yes if the column value contains HTML content.
  17. In the Group by this column section, click Yes if the report items are to be grouped by this item.
  18. In the Action Payload Key Mapping field, you can display a response key as a link by mapping an action response key, for example, createdDate, to the Item Value field displayed to the end-user as the item When as shown in the previous illustration.
  19. Click Done. The Card Layout Configuration dialog is displayed with the new column added as shown in the following illustration.
    Card Layout with Group By Report - Card Layout Configuration DIalog
  20. Repeat Steps 10 – 19 for each additional column in the report, click Save to save the column configurations, and then click Close.
  21. In the Report Template Definition section, click Save to save the card layout with group by report.

The table is saved Successfully saved response data message is displayed at the top of the page.