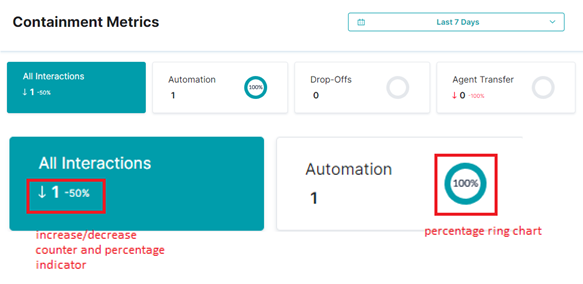
The Containment Metrics section displays the summary data, count increment or decrement, and the percentage ring chart for the following key interaction metrics based on the selected date and time range values.
- All interactions
- Automation
- Drop-offs
- Agent Transfer
All Interactions
This metric provides an overall summary along with Task Completion Rate, Intent Identification Rate, and Deflection Rate.
All Interactions typically answer questions like:
- What percentage of customers are getting their questions answered?
- What percentage of intents are detected correctly?
- Are customers opting for optional deflections?
Automations
This metric gives a summary of the overall daily automations along with the most popular automations, Total Automation Time, and Average Interaction Time.
Automations typically answer questions like:
- How are automations trending on an overall basis?
- What are the most popular Use Cases?
Drop-Offs
It gives an overview of Drop-Offs along with conversations and unidentified utterances before a drop-off.
Drop-offs are conversations where the intent is left unfulfilled. From the drop-offs section, you can get detailed insights into the drop-off behavior of your customers along with the length of the conversation before the drop-off occurs.
Agent Transfer
It gives an overview of Agent Transfers along with conversations and utterances captured before agent transfers are invoked.
Other Containment Metrics
Containment Metrics also include the following metrics based on the time and date range selection:
Total Interactions
This section displays the date-wise activity chart data.
The bar graphs are displayed for the following metrics:
- Total Activity: Represents the total count of all the interaction activities.
- Automation: Depicts the call and chat automation counts.
- Deflection: Shows the call and chat deflection counts.
- Drop-offs to represent the number of calls or chats dropped off by the customer.
- Agent Transfer representing the call or chat agent transfers.


