가상 비서를 구축하고 학습시키고 나면, Kore.ai 플랫폼이 봇 의도로 사용자 발화를 매핑하는 ML 모델을 구축합니다(자세한 정보를 보려면 여기를 클릭하세요). 생성하고 나면, ML 모델의 편파적이지 않은 일반화 성능을 이해하고 추정하기 위해 모델을 검증하는 것이 좋습니다. Kore.ai 가상 비서 플랫폼은 두 가지 검증 방법을 제공합니다.

  • 기계 학습 모델의 성능을 시각화하는 혼돈 지표 또는 오류 지표.
  • 기계 학습 모델의 기술 추정을 위한 K-fold 교차 검증.

검증 모델을 선택하려면 다음 단계를 따르세요.

  1. ML 모델을 검증하려는 봇을 열고 상단 메뉴에서 빌드를 선택합니다.
  2. 왼쪽 메뉴에서, 자연어 -> 학습을 클릭합니다.
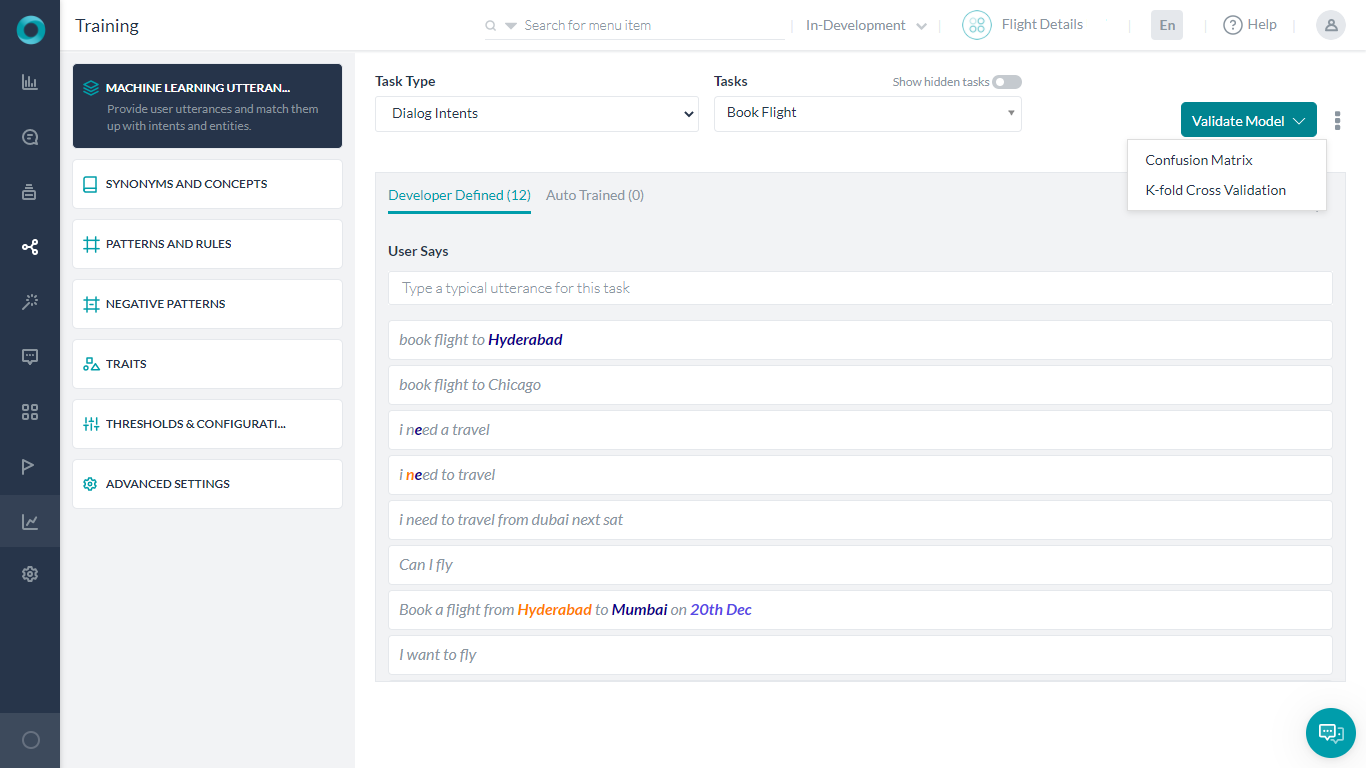
  3. 오른쪽 상단의 검증 모델 드롭 다운 목록을 클릭하고 모델을 선택합니다.
  4. 해당 유효성 검사 방법의 결과 페이지가 나타납니다.


다음 섹션에서는, 이러한 각 방법을 자세히 살펴보겠습니다.

K-fold 교차 검증

교차 검증은 제한된 데이터 샘플에서 기계 학습 모델을 평가하는 데 사용되는 리샘플링 절차입니다. 이 기술에는 데이터를 부분 집합으로 분할하고, 부분 집합에 대한 데이터를 학습시키고 다른 부분 집합을 사용하여 모델의 성능을 평가하는 작업이 포함됩니다. 교차 검증을 통해 ML 모델의 성능에 대한 더 나은 지표인 모델 성능에 대한 보다 일반화된 지표를 제공합니다.

구성

K-fold 교차 검증을 지원하는 Kore.ai 가상 비서 플랫폼. 이를 위해, 고급 NLP 설정에서 교차 검증을 위한 K-fold 매개 변수를 설정해야 합니다. 자세한 내용을 보려면 여기를 클릭하세요. 학습을 시작하고 K-fold 검증 보고서를 생성하려면 다음 단계를 따르세요.

  1. 왼쪽 메뉴의 빌드 상단 메뉴 옵션에서 자연어 -> 학습을 클릭합니다.
  2. 기계 학습 발화 페이지에서 오른쪽 상단의 검증 모델 드롭 다운 목록을 클릭하고 K-fold 교차 검증을 선택합니다.
  3. K-fold 교차 검증 페이지에서 생성을 클릭하여 학습을 시작하고 K-fold 검증 보고서를 생성합니다. 생성 버튼은 교차 검증을 처음 수행할 때만 나타납니다.
  4. 보고서가 생성된 후 오른쪽 상단의 재생성 버튼을 클릭하여 필요할 때 보고서를 다시 생성할 수 있습니다.

참고: 학습에 사용된 총 ML 발화 수가 250개 이상인 경우에만 검증이 수행됩니다. 온 프레미스 설치에 이 숫자를 설정할 수 있습니다. 자세한 내용은 지원팀에 문의하세요.

구현

다음은 K-fold 교차 검증을 수행하는 동안 플랫폼이 따라야 하는 단계입니다.

  • 전체 발화 세트는 무작위로 학습 데이터 세트와 테스트 데이터 세트로 나뉩니다.
  • 같은 수의 학습 발화가 있는 각 부분 집합과 함께 전체 학습 데이터를 k fold로 분할합니다. k fold의 값은 위에서 언급한 대로 설정해야 합니다.
  • 그런 다음 시스템은 k만큼 반복을 실행하고 각 반복에서 발화의 부분 집합(fold)을 나머지 부분 집합('k – 1’ fold)으로 학습시킨 모델로 테스트합니다.
  • 성능 측정 계산을 위해 테스트 데이터 세트에서 결과 모델이 검증됩니다.
  • 이 프로세스는 모델 테스트를 위해 모든 발화를 한 번 이상 사용할 때까지 반복됩니다.
  • ML 모델의 성능을 평가하는 데 도움이 되도록 K fold 교차 검증 후에 지표를 제공합니다.

결과 이해

K fold 교차 검증 후에 다음 지표를 제공합니다.

  • 각 테스트 fold의 정밀도 점수 – 모델이 얼마나 정밀하고 정확한지 정의하고 예측한 총 긍정에 대한 참 긍정의 비율(참 및 긍정 오류의 합)으로 계산합니다.
  • 각 테스트 fold의 회수율 점수 – 성공적으로 식별된 관련 발화의 비율을 정의하고 실제 긍정에 대한 참 긍정의 비율(참 긍정과 부정 오류의 합)으로 계산합니다.
  • 각 테스트 fold의 F1 점수는 클래스 분포를 고르게 하고 정밀도와 재현율 사이의 균형을 찾으며 정밀도와 재현율의 가중 평균으로 계산합니다.
  • 모든 fold의 정밀도, 재현율 및 F1 점수의 평균입니다.

관련 지표를 더 잘 이해하도록 다음 정보도 제공합니다.

  • 총 발화 – 학습 말뭉치의 발화 수
  • 의도 수 – 봇의 총 의도 수
  • Fold 수 – 학습 말뭉치가 K-fold 매개 변수로 분할된 부분 집합 수
  • Fold 당 테스트 데이터 – 테스트에 사용된 각 부분 집합의 발화 수
  • Fold 당 학습 데이터 – 학습에 사용된 각 부분 집합의 발화 수

참고: 이러한 결과는 더 큰 발화 데이터 세트(최소한 250개 발화)에서 수행할 때 ML 모델의 성능을 더 정확하고 표본을 잘 나타내게 됩니다.

K-fold 교차 검증 보고서 내보내기

K-fold 교차 검증 보고서를 생성한 후, CSV 형식으로 보고서를 내보낼 수 있습니다. 검증 보고서를 가져오려면 다음 단계를 따르세요.

  • K-fold 교차 검증 페이지에서 오른쪽 상단의 내보내기 아이콘을 클릭합니다.
  • 보고서 내보내기 대화 상자에서 계속하기를 클릭합니다.

내보낸 파일은 다음 형식으로 나타납니다. Kfold_BotName_YYYYMMDDHHmmSS.csv.

혼돈 지표

혼돈 지표는 실제 값이 알려진 테스트 데이터 세트의 분류 모델(또는 분류기)의 성능을 설명하는 데 유용합니다. 혼돈 지표를 통해 생성된 그래프는 봇 작업의 학습된 발화 성능을 한 눈에 볼 수 있게 해줍니다. 이름은 모델이 발화를 혼동하는지 쉽게 확인할 수 있다는 점에서 유래한 것입니다. ML 모델 그래프는 각 봇 작업에 대한 학습용 발화를 평가하고 다음 사분면 중 하나에 표시합니다. True Positive (True +ve), True Negative (True -ve), False Positive (False +ve), False Negative (False -ve). 그래프를 간단히 살펴보면 어떤 발화 의도 일치가 정확한지, 어떤 발화 결과를 더 나은 결과를 생성하기 위해 추가로 학습시킬 수 있는지 알 수 있습니다. 사분면의 발화가 높아질수록 예상되는 동작이 더 잘 나타납니다. True +ve는 학습된 작업과의 강력한 일치를 나타내고 True -ve는 예상한대로 관련 없는 의도와의 불일치를 나타냅니다. 사분면에서 중간 수준의 발화는 더 나은 점수를 받도록 추가로 학습시킬 수 있습니다. 오류 사분면에 속하는 발화는 즉각적인 주의가 필요합니다. 의도한 작업과 일치하지 않거나 잘못된 작업과 일치하는 발화입니다. 사분면에서 발화 텍스트를 읽으려면, 그래프의 점 위로 마우스를 이동합니다.

참 긍정 사분면

의도에 대해 학습시킨 발화가 해당 의도에 대해 긍정적인 신뢰도 점수를 받으면 참 긍정 사분면에 속하게 됩니다. 이 사분면은 적합한 결과를 나타냅니다. 그러나 발화가 사분면 척도의 높은 곳에 있을수록 올바른 의도를 찾을 가능성도 커집니다. 참고: 여러 봇 작업의 참 긍정 사분면에 속하는 발화는 수정해야 하는 겹치는 봇 작업을 나타냅니다.

참 부정 사분면

의도에 대해 학습시키지 않은 발화가 해당 의도에 대해 부정적인 신뢰도 점수를 받으면 참 부정 사분면에 속하게 됩니다. 이 사분면은 발화가 의도와 일치하지 않아야 하므로 적합한 결과를 나타냅니다. 사분면 척도에서 발화가 낮은 곳에 있을수록 의도에서 멀어질 가능성도 커집니다. 특정 봇 작업에 대해 학습시킨 모든 발화는 이상적으로 다른 작업의 참 부정 사분면에 속해야 합니다.

긍정 오류 사분면

의도에 대해 학습시키지 않은 발화가 해당 의도에 대해 긍정적인 신뢰도 점수를 받으면 긍정 오류 사분면에 속하게 됩니다. 이 사분면은 적합하지 않은 결과를 나타냅니다. 이러한 결과를 대해, 최적의 결과를 위해서는 발화, 의도된 봇 작업 및 일치하지 않는 작업을 학습시켜야 할 수 있습니다.

부정 오류 사분면

의도에 대해 학습시킨 발화가 해당 의도에 대해 부정적인 신뢰도 점수를 받으면 참 부정 사분면에 속하게 됩니다. 이 사분면은 발화가 의도와 일치해야 하므로 적합하지 않은 결과를 나타냅니다. 이러한 결과를 대해, 최적의 결과를 위해서는 발화, 의도된 봇 작업 및 작업을 학습시켜야 합니다. 자세히 알아보려면 기계 학습 부분을 읽어보세요. 참고: ML 모델 그래프에 반영하도록 봇을 변경한 후 학습 버튼을 클릭해야 합니다. 그래프를 참조할 때 다음 핵심 사항을 염두에 두세요.

  • 참 사분면의 발화가 높은 곳에 있을수록 예상되는 동작이 더 잘 나타납니다.
  • 참 사분면에서 중간 수준의 발화는 더 나은 점수를 받도록 추가로 학습시킬 수 있습니다.
  • 오류 사분면에 속하는 발화는 즉각적인 주의가 필요합니다.
  • 여러 봇 작업의 참 사분면에 속하는 발화는 수정해야 하는 겹치는 봇 작업을 나타냅니다.

좋은/나쁜 ML 모델에 대한 이해

좋은 ML 모드 또는 나쁜 ML 모드를 이해하기 위한 예로 뱅킹 봇을 살펴보겠습니다. 봇에는 300개 이상의 학습된 발화 등 여러 작업이 있습니다. 아래 이미지는 4가지 작업 및 관련 발화를 보여줍니다. 이 시나리오의 모델은 작업과 관련된 대부분의 발화가 참 긍정 사분면에 모여 있고 다른 작업의 대부분의 발화가 참 부정 사분면에 모여 있어 상당히 잘 학습된 것입니다. 개발자는 이 모델의 다음 측면을 개선하기 위해 노력할 수 있습니다.

  • '계좌 잔고 가져오기' 작업의 ML 모델에서, 긍정 오류 사분면의 발화(B) 몇 개를 볼 수 있습니다.
  • 계정 잔고 가져오기에 학습된 발화는 참 부정 사분면(C)에 나타납니다.
  • 모델이 잘 학습되어 있고 이 작업에 대한 대부분의 발화가 참 긍정 사분면에서 높은 곳에 있지만 일부 발화는 여전히 매우 낮은 점수를 받았습니다. (A)
  • 점 위로 마우스를 이동하면 발화를 볼 수 있습니다. A, B, C의 경우, 발화가 의도와 정확히 일치해야 하지만, 유사한 발화가 다른 의도를 위해 학습되었기 때문에 낮은 점수 또는 부정적인 점수를 받았습니다.
    참고: 이러한 경우, 테스트 및 학습 모듈로 발화를 시도하고 ML 엔진이 반환하는 의도와 관련 샘플 발화를 확인하는 것이 가장 좋습니다. 발화를 미세 조정하고 다시 시도하세요.
  • 카드 분실 신고라는 작업에는 함께 모여 있는 제한된 발화가 포함되어 있습니다.

이제 아래 여행 봇의 ML 모델과 비교해 보겠습니다. 충돌하는 발화를 사용한 학습이 많아 모델의 발화가 여기저기 흩어져 있습니다. 이는 잘못된 모델로 간주하며 봇의 여러 작업과 관련이 없는 더 작은 발화 집합으로 다시 학습시켜야 합니다.

특정 작업 발화의 그래프 보기

기본적으로, ML 모델 그래프는 모든 봇 작업에 학습시킨 모든 발화의 성능을 보여줍니다. 기타 모든 의도에 대한 특정 봇 작업의 학습된 발화 성능을 보려면, 아래 이미지와 같이 봇 작업의 스위치를 토글합니다.

참고: 이들은 첫 번째 봇 작업의 학습된 발화이므로 이상적으로는 발화가 해당 작업의 True +ve 사분면의 상단과 기타 모든 작업의 True -ve 사분면의 하단에 나타나야 합니다.

ML 모델 그래프 필터링

다음 기준에 따라 ML 모델 그래프는 필터링할 수 있습니다.

  • 개발 중 또는 게시된 작업: 기본적으로 그래프는 개발 중게시된 모든 작업의 그래프를 표시합니다. 게시된 작업의 그래프만 보려면 스위치를 토글합니다.
  • 약-강: 가장 정확하지 않은 작업 점수에서 가장 정확한 점수까지 그래프를 봅니다.
  • 강-약: 가장 정확한 작업 점수에서 가장 정확하지 않은 점수까지 그래프를 봅니다.
  • 작업/의도: 그래프를 보려면 모두 선택하거나 특정 작업 이름을 선택하세요.
  • 발화: 그래프를 보려면 모두 선택하거나 특정 학습 발화를 선택하세요.

발화 편집 및 재할당

사용자 발화를 편집하고 다른 작업에 재할당하여 ML 그래프에서 직접 점수를 개선할 수 있습니다. 이렇게 하려면 사분면을 클릭하여 작업 이름 및 모든 관련 발화가 나타나는 사분면 보기를 엽니다. 개별 발화를 편집하려면

  1. 해당 발화 행에서 편집 아이콘을 클릭합니다.
  2. 발화 편집 창에서, 발화 필드의 텍스트를 변경하거나 예상 작업 드롭 다운 목록으로 발화를 다른 작업에 다시 할당합니다.

참고: 전체 사분면 대신 ML 그래프에서 개별 점을 클릭하여 이 창을 열 수도 있습니다.

Leave a Reply

Your email address will not be published. Required fields are marked *

Fill out this field
Fill out this field
Please enter a valid email address.
You need to agree with the terms to proceed

お客様のバーチャルアシスタントを構築およびトレーニングすると、Kore.aiプラットフォームは、ユーザーの発話をBotのインテントにマッピングするMLモデルを構築します(詳細はこちらをクリック)。作成したら、MLモデルの不偏の一般化能力を把握および推定できるようモデルを検証しておくと良いでしょう。 Kore.aiのバーチャルアシスタントプラットフォームでは、以下の2つの検証方法をご利用いただけます。

  • 混同行列またはエラーマトリックスを使用して、機械学習モデルのパフォーマンスを可視化します。
  • K-分割交差検証で機械学習モデルのスキルを推定します。

トレーニング > 機械学習の発話から、モデルを検証ドロップダウンリストを使用して検証方法を選択することで、検証モデルを選択することができます。対応する検証方法の結果ページに移動します。 以下のセクションでは、それぞれの方法について詳しく説明します。

K-分割交差検証

(プラットフォームのバージョン8.0で導入) 交差検証は、限られたデータサンプル上で機械学習モデルを評価するために使用される再サンプリング手順です。この手法は、データを部分集合に分割し、ある部分集合でデータをトレーニングし、その他の部分集合をモデルのパフォーマンス評価に使用することを含みます。交差検証を実行することで、モデルのパフォーマンスに関するより一般的な指標が得られます。これはMLモデルのパフォーマンスのより優れた指標です。

設定

Kore.aiのバーチャルアシスタントプラットフォームは、K-分割交差検証をサポートしています。このため、お客様はNLPの詳細設定からK-分割パラメータを交差検証用に設定する必要があります。詳細はこちらをクリックしてください。 トレーニングを開始し、K-分割検証レポートを生成するには、以下の手順に従います。

  1. Botサマリーページの左側のペインで、自然言語 > トレーニングをクリックします。
  2. トレーニングページで、右上のモデルの検証ドロップダウンリストをクリックし、K-分割交差検証を選択します。
  3. K-分割交差検証ページで、生成をクリックしてトレーニングを開始し、K-分割検証レポートを生成します。生成ボタンは、初めて交差検証を実行したときにのみ表示されます。
  4. レポート生成後は、右上の再生成ボタンをクリックすると、必要に応じてレポートを再度生成することができます。

:検証は、トレーニングに使用されたML発話の総数が250以上の場合にのみ実行されます。この数はオンプレミスのインストールで設定可能です。詳細はサポートチームにお問い合わせください。

実装

以下は、K-分割交差検証の実行中にプラットフォームが従う手順です。

  • 一連の発話はすべて、トレーニングデータセットとテストデータセットにランダムに分割されます。
  • トレーニングデータ全体が「K」分割に分割され、それぞれのサブセットには同数のトレーニングする発話が含まれます。「K」分割の値は、上述のように設定を行う必要があります。
  • その後システムは「K」反復を実行し、それぞれの反復では、発話のサブセット(分割)が残りのサブセット(「K-1」分割)を使用してトレーニングされたモデルに対してテストされます。
  • 結果として得られたモデルは、パフォーマンス測度を計算するためにテストデータセット上で検証されます。
  • このプロセスは、すべての発話がモデルのテストに少なくとも1回は使用されるまで繰り返されます。
  • メトリクスは、MLモデルのパフォーマンスを評価する際に役立つよう、K-分割交差検証後に提供されます。

結果の把握

以下のメトリクスは、K分割交差検証後に提供されます。

  • それぞれのテスト分割の精度スコア – モデルの精度/正確さを定義するためのもので、予測された陽性の合計(真陽性と偽陽性の合計)に対する真陽性の比率として計算されます。
  • それぞれのテスト分割のリコールスコア – 正常に識別された関連する発話の割合を定義するためのもので、実際の陽性(真陽性と偽陰性の合計)に対する真陽性の割合として計算されます。
  • それぞれのテスト分割のF1スコア – クラス分布を均等にし、精度とリコールのバランスを求めるためのもので、精度とリコールの加重平均として計算されます。
  • すべての分割の精度、リコール、F1スコアの平均

関連するメトリクスの理解を深めるために、以下の情報も提供しています。

  • 発話の合計 – トレーニングコーパスに含まれる発話の数
  • インテント数 – Bot内のインテントの総数
  • 分割の数 – トレーニングコーパスが分割されたサブセットの数、K-分割パラメータ
  • 分割あたりのテストデータ – テストに使用される各サブセットの発話数
  • 分割あたりのトレーニングデータ – トレーニングに使用される各サブセットの発話数

:これらの結果は、より正確で、少なくとも250の発話を含む大規模な発話データセットで実行した場合のMLモデルのパフォーマンスの代表的なものです。

K-分割交差検証レポートのエクスポート

(プラットフォームのバージョン8.1で導入) K-分割交差検証レポートを生成したら、レポートをCSV形式でエクスポートすることができます。検証レポートをエクスポートするには、以下の手順に従ってください。

  • K-分割交差検証ページで、右上のエクスポートアイコンをクリックします。
  • レポートのエクスポートダイアログ ボックスで、続行をクリックします。

エクスポートされたファイルは以下の形式で表示されます。 Kfold_BotName_YYYYMMDDHHmmSS.csv.

混同行列

(以前のMLモデルを指す) 混同行列は、真の値が既知のテストデータのセット上における分類モデル(または「分類子」)のパフォーマンスを記述するのに便利です。混同行列によって生成されたグラフは、Botタスクに対するトレーニング済みの発話のパフォーマンスを一目で確認することができます。混同行列という名前は、モデルが発話を混同させているかどうかを簡単に確認できるという事実に由来しています。 MLモデルグラフは、それぞれのBotタスクに対してすべてのトレーニング発話を評価し、それらを真陽性(True +ve)、真陰性(True -ve)、偽陽性(False +ve)、偽陰性(False -ve)のいずれかにプロットします。グラフを見ると、どの発話とインテントの一致が正確で、良い結果を生み出すためにさらにトレーニングすべきかがわかります。 の象限での発話が高い位置にあるほど、期待される動作を示します – True +veはトレーニング対象のタスクとの強い一致を表し、True -veは予想どおり無関係なインテントとの不一致を表します。象限のある程度の発話は、より良いスコアを得るためにさらにトレーニングすることができます。 象限に分類される発話には注意が必要です。これらは、意図したタスクと一致していない、あるいは間違ったタスクと一致している発話です。任意の象限の発話テキストを読むには、グラフのドットにカーソルを合わせてください。

真陽性の象限

インテントに対してトレーニングされた発話が、そのインテントに対して陽性の信頼度スコアを受け取った場合、その真陽性の象限に分類されます。この象限は、好ましい結果を表しています。しかし、象限の尺度上の発話が高い位置にあるほど、正しいインテントを見つけられる可能性が高くなります。 :複数のBotタスクの真陽性の象限に該当する発話は、修正が必要なBotタスクが重複していることを表しています。

真陰性の象限

インテントに対してトレーニングされていない発話が、そのインテントに対して陰性の信頼度スコアを受け取った場合、真陰性の象限に分類されます。この象限は、その発話がインテントと一致することが想定されていないため、好ましい結果を表しています。この象限の尺度上の発話が低い位置にあるほど、発話がインテントから離れている可能性が高くなります。特定のBotタスクのためにトレーニングされたすべての発話は、理想的には他のタスクの真陰性の象限に分類されるべきです。

偽陽性の象限

インテントに対してトレーニングされていない発話が、そのインテントに対して陽性の信頼度スコアを受け取った場合、その発話は偽陽性の象限に分類されます。この象限は、好ましくない結果を表しています。このような結果の場合、最適な結果を得るためには、発話、意図されたBotタスク、および一致が不正確なタスクをトレーニングする必要があります。

偽陰性の象限

インテントに対してトレーニングされた発話が、そのインテントに対して陰性の信頼度スコアを受け取った場合、偽陰性の象限に分類されます。発話がインテントと一致すると想定されるため、この象限は好ましくない結果を表しています。このような結果の場合、最適な結果を得られるよう発話、意図されたBotタスク、タスクをトレーニングする必要があります。詳細については機械学習を参照してください。 :MLモデルグラフに反映させるために、Botに変更を加えた後は、必ず[トレーニング]ボタンをクリックしてください。 グラフを参照する際には、以下の重要なポイントを考慮してください。

  • 真の象限の高い位置にある発話は、期待される動作をよく示します。
  • 真の象限の中間に位置する発話は、より良いスコアを得るためにさらにトレーニングする必要があります。
  • 偽の象限の低い位置にある発話には、注意する必要があります。
  • 複数のBotタスクの真の象限に該当する発話は、修正が必要なBotタスクが重複していることを示しています。

良い/悪いMLモデルについての理解

MLモードの良し悪しを理解するための一例として、ある銀行のBotをもとに考えてみましょう。このBotには、300以上のトレーニング済みの発話を含む、複数のタスクがあります。下の画像は、4つのタスクとそれに関連した発話を示しています。 このシナリオのモデルはかなりよくトレーニングされており、タスクに関連する発話のほとんどが真陽性の象限に集中しており、他のタスクの発話のほとんどは真陰性の象限にあります。 開発者は、このモデルの以下の点を改善することに努めます。

  • 「Get Account Balance」というタスクのMLモデルでは、偽陽性の象限にいくつかの発話(B)が見られます。
  • 「Get Account Balance」用にトレーニングされた発話は、真陰性の象限(C)に表示されます。
  • モデルは十分にトレーニングされており、このタスクの発話のほとんどは真陽性の象限の上部に位置していますが、一部の発話のスコアは依然として非常に低いままです。(A)
  • ドットの上にカーソルを置くと、発話が表示されます。A、B、Cの場合、発話はインテントと完全に一致しているはずにもかかわらず、類似する発話が別のインテント用にトレーニングされているため、スコアが低い、あるいはマイナスになっています。
    :このような場合には、テスト > トレーニングモジュールを用いて、MLエンジンが返すインテントとそれに関連するサンプル発話を確認することをお勧めします。発話を調整してからもう一度お試しください。
  • Report Loss of Cardというタスクには、集結した限定的な発言が含まれています。

以下のトラベルBotのMLモデルと比較してみましょう。 モデルは多くの矛盾する発話とともにトレーニングされているため、結果として発話が分散しています。これは悪いモデルとみなされ、Bot内の複数のタスクに関連していない、より小さな発話のセットで再度トレーニングする必要があります。

特定のタスクの発話のグラフ表示

MLモデルグラフには、すべてのBotタスクに対してトレーニングされたすべての発話のパフォーマンスがデフォルトで表示されます。他のすべてのインテントに対する特定のBotタスクのトレーニングされた発話のパフォーマンスを表示するには、下の画像のように、そのBotタスクのスイッチを切り替える必要があります。 :これらは最初のBotタスクのトレーニングされた発話であるため、発話はそのタスクのTrue +ve象限の上部に、他のすべてのタスクのTrue -ve象限の下部に表示されるのが理想的です。

MLモデルグラフのフィルタリング

MLモデルグラフを以下の条件でフィルタリングすることができます。

  • 開発中または公開済み:デフォルトでは、開発中と公開済みのすべてのタスクのグラフが表示されます。スイッチを切り替えると、公開済みタスクのみのグラフが表示されます。
  • 弱から強:タスクのスコアが最も正確でないものから最も正確なものまでのグラフを表示します。
  • 強から弱:タスクのスコアが最も正確なものから最も正確でないものまでのグラフを表示します。
  • タスク/インテント:すべてを選択するか、特定のタスク名を選択してグラフを表示します。
  • 発話:すべてを選択するか、または特定のトレーニング済みの発話を選択してグラフを表示します。

発話の編集と再マッピング

MLグラフから直接ユーザーの発話を編集したり、他のタスクに割り当てたりしてスコアを向上させることができます。これを行うには、象限をクリックすると象限ビューが開き、タスク名とそれに関連するすべての発話が表示されます。 個々の発話を編集するには、発話の編集アイコンをクリックします。発話の編集ウィンドウが開きます。予想されるタスクドロップダウン リストを使用して、発話フィールドのテキストを変更したり、他のタスクに発話を再度割り当てたりすることができます。

:このウィンドウは、象限全体ではなく個々のドットをクリックしても開くことができます。

Leave a Reply

Your email address will not be published. Required fields are marked *

Fill out this field
Fill out this field
Please enter a valid email address.
You need to agree with the terms to proceed

Once you have built your virtual assistant and trained it, the Kore.ai platform builds an ML model mapping user utterance with bot intents (click here for more info). Once created, it is recommended to validate the model to understand and estimate an unbiased generalization performance of the ML model.

Kore.ai virtual assistant platform offers two validation methods:

  • Confusion Matrix or Error Matrix to visualize the performance of the machine learning model.
  • K-fold Cross-Validation to estimate the skill of the machine learning model.

To choose the validation model, follow the below steps:

  1. Open the bot you want to validate the ML model and select Build from the top menu.
  2. From the left menu, click Natural Language -> Training.
  3. Click the Validate Model drop-down list on the top-right and select the model.
  4. The results page of the corresponding validation method is displayed.

In the following sections, we will look into each of these methods in detail.

K-fold Cross-Validation

Cross-Validation is a resampling procedure used to evaluate machine learning models on a limited data sample. The technique involves partitioning the data into subsets, training the data on a subset, and using the other subsets to evaluate the model’s performance. Performing Cross-Validation gives a more generalized metric on model performance which is a better indicator of the ML model’s performance.

Configuration

Kore.ai virtual assistant platform supports K-fold Cross-Validation. For this, you must configure the K-fold parameter for cross-validation from the advanced NLP configurations. Click here for more info.

To initiate the training and generate the K-fold validation report, follow the below steps:

  1. From the left menu under the Build top menu option, click Natural Language -> Training.
  2. On the Machine Learning Utterances page, click Validate Model drop-down list on the top-right and select K-fold Cross-Validation.
  3. On the K-fold Cross-Validation page, click Generate to initiate the training and generate the K-fold validation report. Generate button appears only when you perform the cross-validation for the first time.
  4. After the report is generated, you can click the Re-generate button on the top right to regenerate the report when needed.

Note: Validations are performed only when the total number of ML utterances used for training is at least 250. This number is configurable for the on-premises installation. Contact our support team for details.

Implementation

Following are the steps followed by the platform while performing the K-fold cross-validation:

  • The entire set of utterances is randomly divided into training and test data sets.
  • The entire training data is partitioned into k folds with each subset containing an equal number of training utterances. The value for k folds must be configured as mentioned above.
  • The system then runs k iterations and in each iteration, a subset (fold) of utterances is tested against the model trained using the rest of the subsets (‘k – 1’ folds).
  • The resulting model is validated on the test data set to compute the performance measures.
  • This process is repeated until every utterance is used at least once for testing the model.
  • The metrics are provided post K fold cross-validation to help you assess the ML model’s performance.

Understand the Results

The following metrics are provided post the K fold cross-validation:
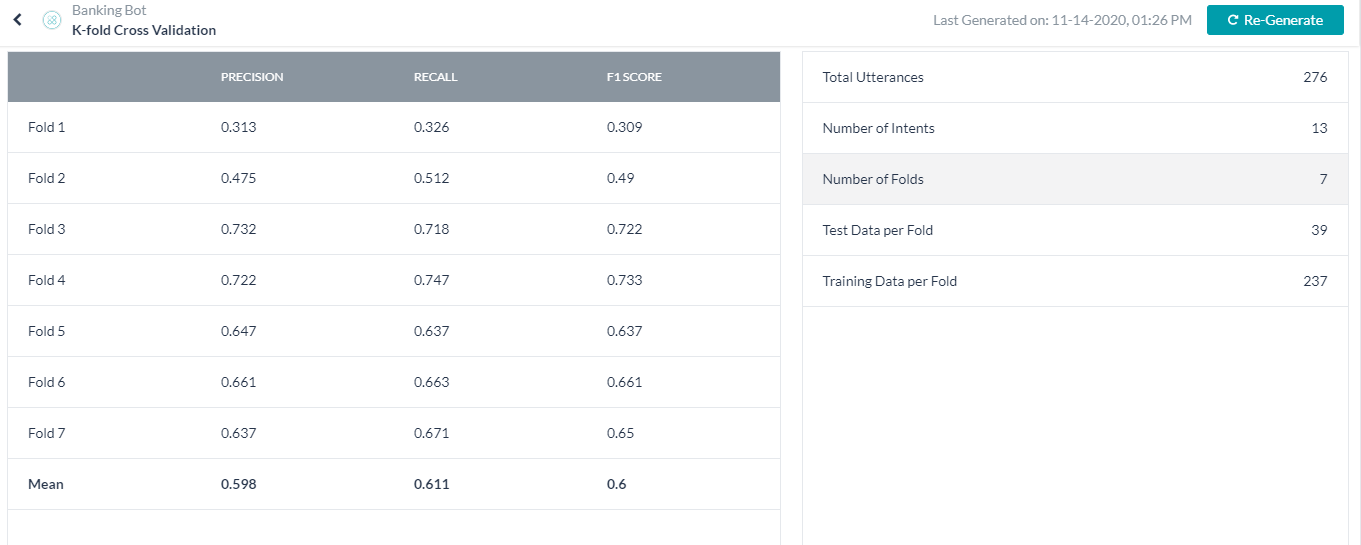
  • The Precision score of each testing fold – to define how precise/accurate your model is and is calculated as the ratio of true positives over total predicted positives (sum of true and false positives)
  • The Recall score of each testing fold – defines the fraction of the relevant utterances that are successfully identified and is calculated as the ratio of true positives over actual positives (sum of true positives and false negatives).
  • The F1 Score of each testing fold – to even out class distribution and seek a balance between precision and recall and is calculated as the weighted average of Precision and Recall.
  • A mean of the precision, recall, and F1 scores for all the folds.

The following information is also provided to help understand the associated metrics better:

  • Total Utterances – number of utterances in the training corpus
  • Number of Intents – total number of intents in the bot
  • Number of Folds – number of subsets the training corpus was divided into the K-fold parameter
  • Test Data per Fold – number of utterances in each subset used for testing
  • Training Data per Fold – number of utterances in each subset used for training

Note: These results are more accurate and representative of the ML Model’s performance when performed on larger utterance datasets, 250 utterances at the least.

Export the K-fold Cross-Validation Reports

After you have generated the K-fold Cross-Validation report, you can export the report in CSV format. To export the validation report, follow the below steps:

  • On the K-fold Cross-Validation page, click the export icon on the top-right.
  • On the Export Report dialog box, click Proceed.

The exported file appears in this format: Kfold_BotName_YYYYMMDDHHmmSS.csv.

Confusion Matrix

Confusion Matrix is useful in describing the performance of a classification model (or classifier) on a set of test data for which the true values are known. The graph generated by the confusion matrix presents an at-a-glance view of the performance of your trained utterances against the bot tasks. The name stems from the fact that it makes it easy to see if the model is confusing utterances.

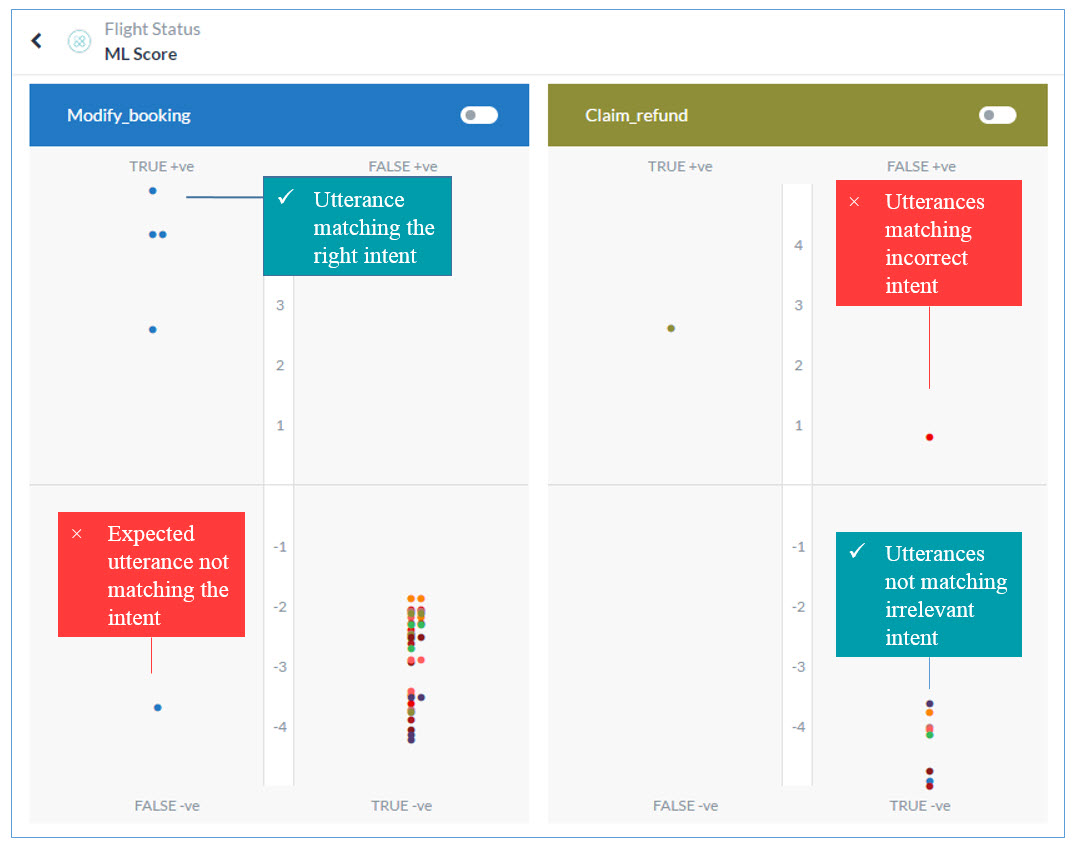
The ML Model graph evaluates all the training utterances against each bot task and plots them into one of these quadrants of the task: True Positive (True +ve), True Negative (True -ve), False Positive (False +ve), False Negative (False -ve). A quick look at the graph and you know which utterance-intent matches are accurate and which can be further trained to produce better results.

The higher the utterance in the True quadrants the better it exhibits expected behavior. True +ve represents a strong match with the task for which they are trained and the True -ve represents a mismatch with the irrelevant intents as expected. Utterances at a moderate level in the True quadrants can be further trained for better scores.

The utterances falling into the False quadrants need immediate attention. These are the utterances that are either not matching with the intended tasks or are matching with the wrong ones. To read the utterance text in any quadrant, hover over the dot in the graph.
True Positive Quadrant

When utterances trained for an intent receive a positive confidence score for that intent, they fall into its True Positive quadrant. This quadrant represents a favorable outcome. However, the higher the utterance on the quadrant’s scale the more chances of it finding the right intent.
Note: Utterances that fall into the true positive quadrants of multiple bot tasks denote overlapping bot tasks that need to be fixed.

True Negative Quadrant

When utterances not trained for an intent to receive a negative confidence score for the intent, they fall into its True Negative quadrant. This quadrant represents a favorable outcome as the utterance is not supposed to match with the intent. The lower the utterance on the quadrant’s scale, the higher the chances of it staying afar from the intent. All the utterances trained for a particular bot task should ideally fall into the True Negative quadrants of the other tasks.

False Positive Quadrant

When utterances that are not trained for an intent receive a positive confidence score for the intent, they fall into its False Positive quadrant. This quadrant represents an unfavorable outcome. For such outcomes, the utterance, the intended bot task, and the incorrectly matching task may have to be trained for optimum results.

False Negative Quadrant

When utterances trained for an intent receive a negative confidence score for the intent, they fall into its False Negative quadrant. The quadrant represents an unfavorable outcome as the utterance is supposed to match with the intent. For such outcomes, the utterance, the intended bot task, and the task need to be trained for optimum outcome. Read Machine Learning to learn more.

Note: Make sure to click the train button after making any changes to your bot to reflect them in the ML Model Graph.

Consider the following key points when referring to the graph:

  • The higher up the utterance in the True quadrants the better it exhibits the expected behavior.
  • Utterances at a moderate level in the True quadrants can be further trained for better scores.
  • The utterances falling into the False quadrants need immediate attention.
  • Utterances that fall into the True quadrants of multiple bot tasks denote overlapping bot tasks that must be fixed.

Understand a Good/Bad ML model

Let us consider a banking bot as an example to understand good or bad ML Mode. The bot has multiple tasks with more than 300 trained utterances. The below image depicts 4 tasks and the associated utterances.
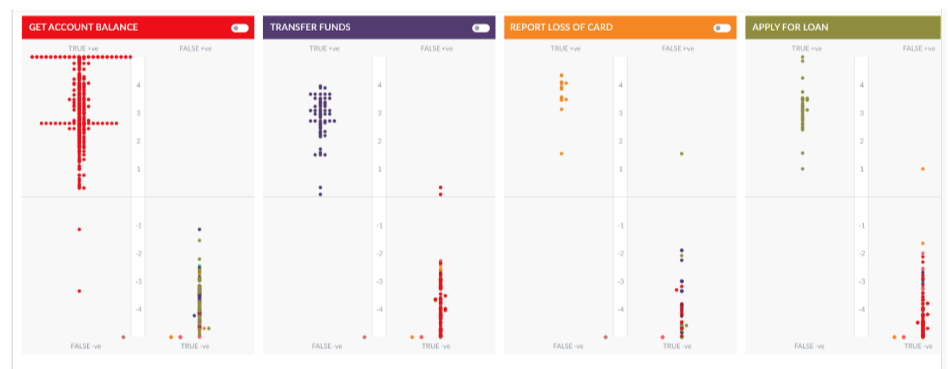
The model in this scenario is fairly well trained with most of the utterances pertaining to a task are concentrated in the True Positive quadrant and most of the utterances for other tasks are in the True Negative quadrant.
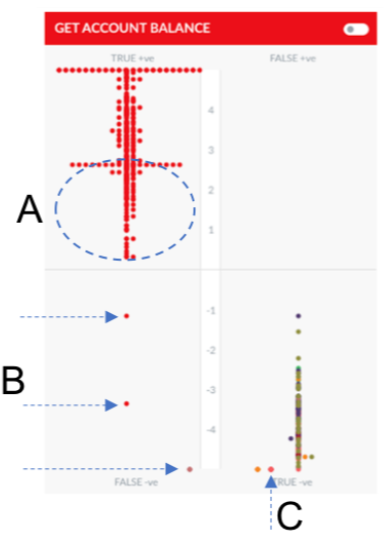
The developer can work to improve on the following aspects of this model:

  • In the ML model for task ‘Get Account Balance’ we can see a few utterances (B) in the False Positive quadrant.
  • An utterance trained for Get Account Balance appears in the True Negative quadrant (C).
  • Though the model is well trained and most of the utterances for this task are higher up in the True Positive quadrant, some of the utterances still have a very low score. (A)
  • When you hover over the dots, you can see the utterance. For A, B, and C, though the utterance should have exactly matched the intent, it has a low or negative score as a similar utterance has been trained for another intent.
    Note: In such cases, it is best to try the utterance with Test & Train module, check for the intents that the ML engine returns and the associated sample utterances. Fine-tune the utterances and try again.
  • The task named Report Loss of Card contains limited utterances that are concentrated together.

Let us now compare it with the ML Model for the Travel Bot below:
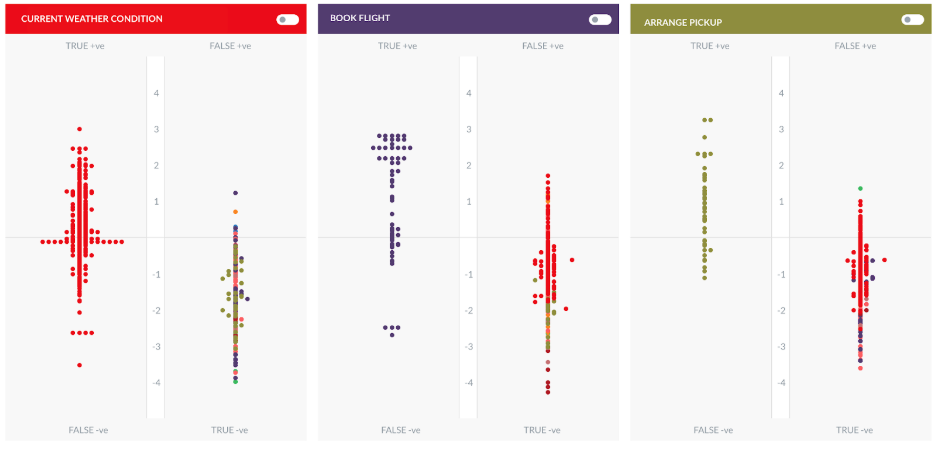
The model is trained with a lot of conflicting utterances, resulting in a scattered view of utterances. This will be considered as a bad model and must be re-trained with a smaller set of utterances that do not relate to multiple tasks in a bot.

View the Graph for Specific Task Utterances

By default, the ML Model Graph shows the performance of all the trained utterances against all bot tasks. To view the performance of a specific bot task’s trained utterances against all the other intents, toggle the switch for the bot task as shown in the image below.
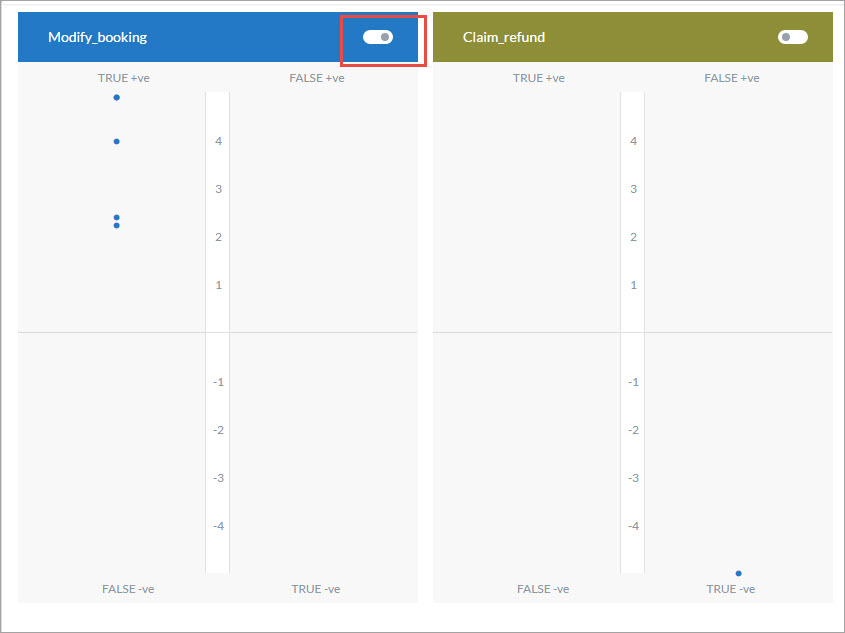

Note: Since these are the trained utterances of the first bot task, ideally the utterances should appear at the top of the True +ve quadrant of that task and the bottom of the True -ve quadrant of all the other tasks.

Filter the ML Model Graph

You can filter the ML Model Graph based on the following criteria:
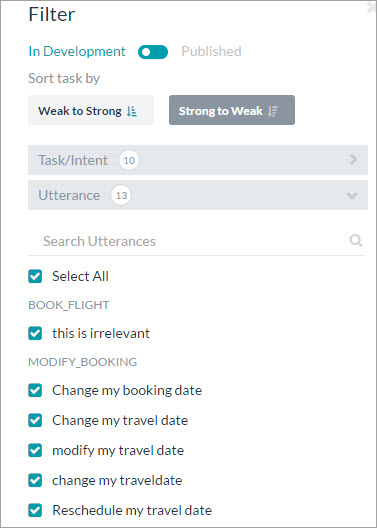
  • In Development or Published: By default the graph shows the graph for all the tasks In Development and Published tasks. Toggle the switch to view the graph for only the published tasks.
  • Weak to Strong: View the graph from the least accurate task scores to the most accurate.
  • Strong to Weak: View the graph from the most accurate task scores to the least.
  • Task/Intent: Select all or select specific task names to view their graph.
  • Utterance: Select all or select specific trained utterances to view their graph.

Edit and Reassign Utterances

You can edit user utterances and re-assign them to other tasks to improve their scores directly from the ML graph. To do this, click on a quadrant and the Quadrant view opens with the name of the task and all the utterances related to it.
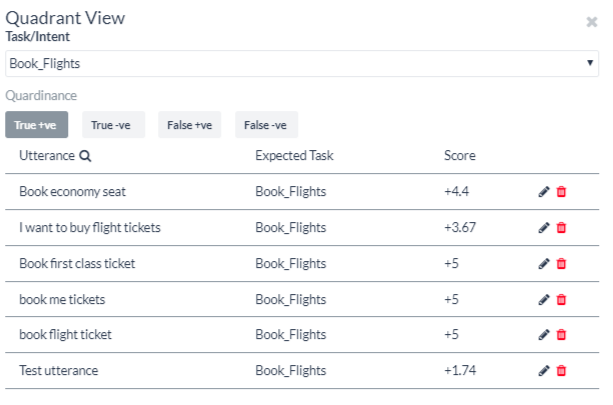
To edit an individual utterance,

  1. Click the edit icon on the respective utterance row.
  2. On the Edit Utterance window, make changes to the text in the Utterance field or reassign the utterance to another task using the Expected Task drop-down list.
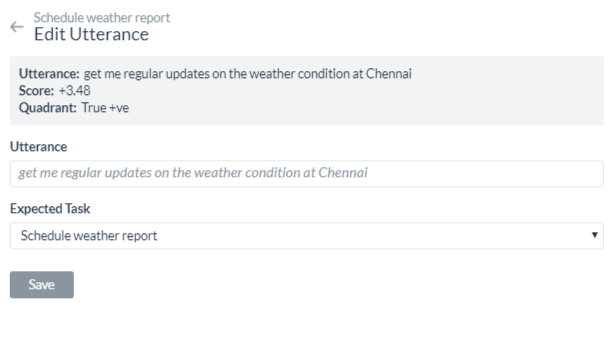
Note: You can also open this window by clicking an individual dot on the ML graph instead of the entire quadrant.

Leave a Reply

Your email address will not be published. Required fields are marked *

Fill out this field
Fill out this field
Please enter a valid email address.
You need to agree with the terms to proceed