Live Board acts as the application dashboard. Contact Center managers can get a bird’s eye view into the current day’s performance of the SmartAssist application.
Managers can perform a variety of analyses and quickly diagnose and deviate from the expected activity with this view. A few scenarios where Live Board can be helpful include:
- Getting a view of the total conversations routed through SmartAssist.
- An understanding of the incoming customer traffic throughout the day.
- Understanding the common support topics that your customers are looking for.
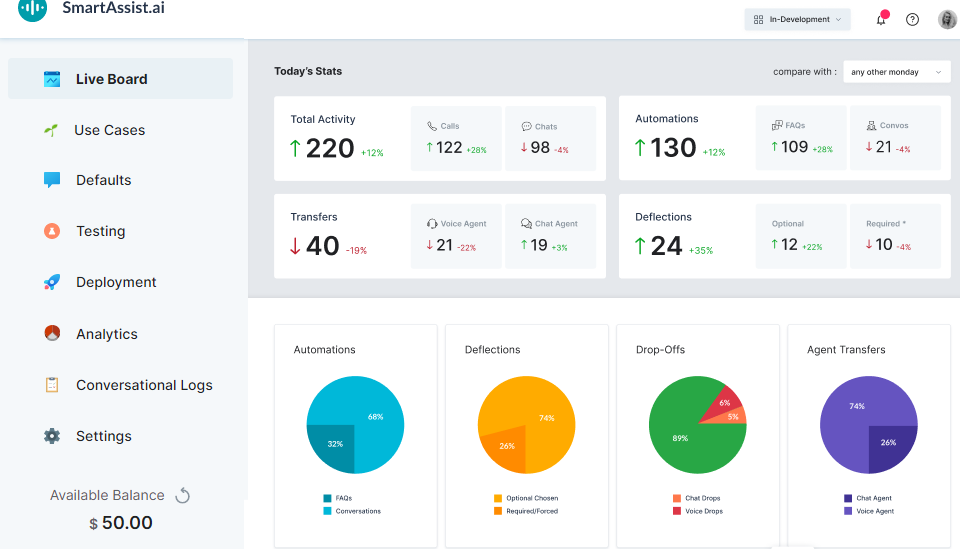
The following metrics are currently available within SmartAssist:
|
Metrics |
Details |
| Total Activity | Overall interactions that have occurred within the SmartAssist application on that day. This is further subdivided into Calls and Chats respectively. |
| Total Automation | A subset of the total activity. Automation counts the number of interactions that do not involve any human interaction. These are further subdivided into Q&As and Conversations. |
| Total Transfers | Another subset of total activity. This section counts the total number of interactions that have involved a transfer. These are further subdivided into Chat and Voice agent transfers. |
| Total Deflections | A count of the total deflections on SmartAssist. These are further subdivided into Forced vs Optional deflections, depending on the customer. |
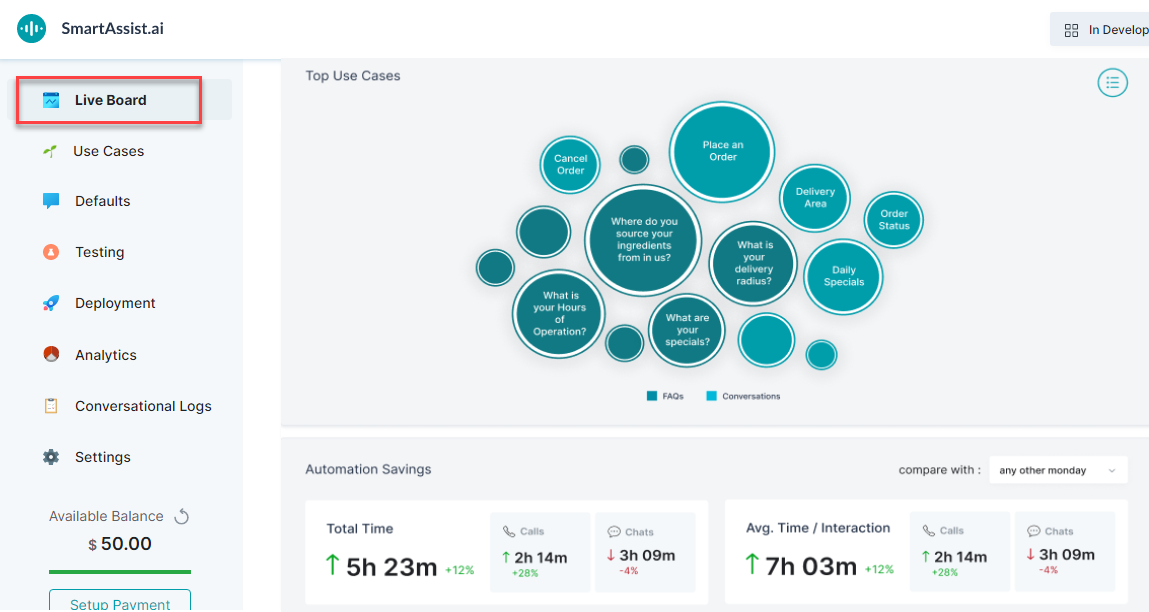
| Top Use Cases | This includes the day’s most popular use cases, available in a text bubble and a tabular format. |
| Automation Savings | Indicates the total amount of time that customers have spent interacting with Voice Bots and Chat Bots, and is a direct measure of the amount of time saved for humans. |
| Average Interaction Time | Average time spent per interaction. (This does not include time spent once calls have been transferred to an agent yet). This information is also available individually for chat and voice channels. |
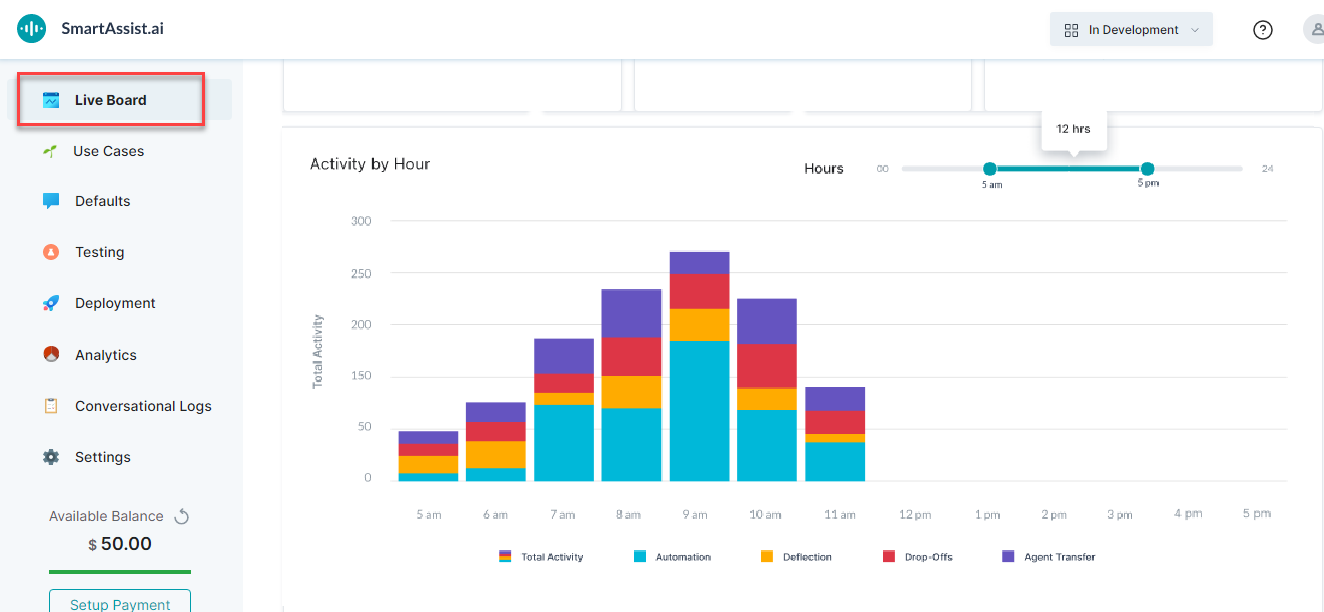
| Hourly Activity | Bar chart-based visual highlighting interaction volumes throughout the day. |